 Aspecten
 Download (8 MB)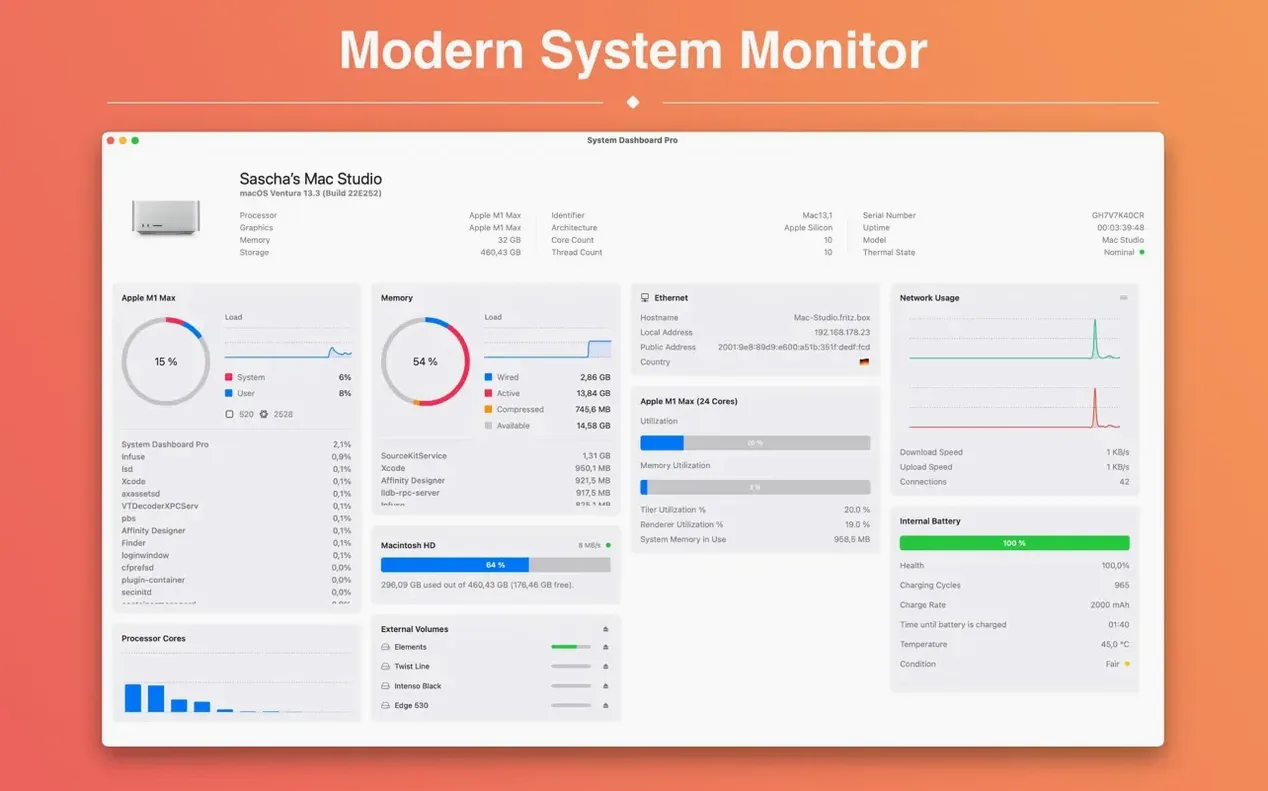
The Battery panel, with its simple percentage and cycle count, is often where I start when a MacBook feels warm and the fans are audible for no obvious reason. Opening System Dashboard Pro and glancing at the CPU History line chart usually confirms whether a background task has taken hold. The app arranges its data into separate panels — CPU, Memory, Network, Storage, Battery, plus a Sensors section covering temperatures and fans — and you can show or hide each one from the View menu.
The workflow is straightforward: drag the panels you need into view, resize the window to suit, and leave it on a secondary display or tucked at the side of the desktop. When the machine slows, switching to the Processes tab sorts running tasks by CPU or memory use, so the culprit appears at the top of the list without any digging. An overview panel also pulls together the macOS version, processor model and physical memory at a single glance, which saves a trip through System Settings.
Good for
- Spotting a single runaway process by sorting live CPU and memory lists
- Watching network throughput on a simple, auto-scaling graph
- Checking battery health and cycle count without hidden menus
- Monitoring temperatures and fan speeds across multiple sensors
Keep in mind
- Panel arrangement is manual; there is no preset dashboard layout for different tasks
- Live graphs show recent history only, with no built-in long-term logging
Questions before installing
People often ask whether System Dashboard Pro replaces Activity Monitor. It does not — the two sit alongside each other. Activity Monitor remains the tool for forcing a process to quit or inspecting open files and ports; this app reads the same underlying data but presents it in resizable, glanceable panels. Another common question concerns resource use of the monitor itself. On an Apple Silicon Mac the overhead is barely visible, typically well under one percent of CPU, because the app polls the system at a steady interval rather than sampling at maximum frequency. A third question revolves around sensor access: the app reads fan speeds and temperature values directly from the SMC, so no extra kernel extension or driver is needed, and the readings match what Apple Diagnostics would report.
What changed in recent versions
Version 4.4 brought a reworked Sensors panel that surfaces more temperature readouts — CPU proximity, GPU die, battery and SSD controller — grouped under collapsible headers rather than a single flat list. The Network panel gained a per-process connection counter, so alongside upload and download rates you can see how many active sockets a browser or sync client holds open at any moment. A quieter but welcome change is that the memory pressure graph now uses the same colour thresholds as Activity Monitor: green for low pressure, amber for moderate, red when the system is actively compressing or swapping. On the layout side, panel widths snap to a grid when you drag them, making it easier to align two or three panels side by side without pixel-level adjustments.
A real-world scenario
A freelance video editor keeps System Dashboard Pro open on a small secondary display while rendering a timeline in DaVinci Resolve. The CPU History panel shows all performance cores pinned near 100 percent, as expected, but the Sensors section reveals that the GPU die has climbed to 88 °C and the left fan is still running below 3000 rpm. The editor opens the MacBook slightly to improve airflow and watches the fan curve rise to 4500 rpm over the next thirty seconds, bringing the temperature down to a steadier 78 °C. After the render finishes, the memory panel confirms that Resolve released its working set properly — free memory climbs back to the pre-render baseline within a minute. No guessing, no buried menus, just a handful of panels that show exactly what the hardware is doing while real work runs.