 Aspecten
 Download (30 MB)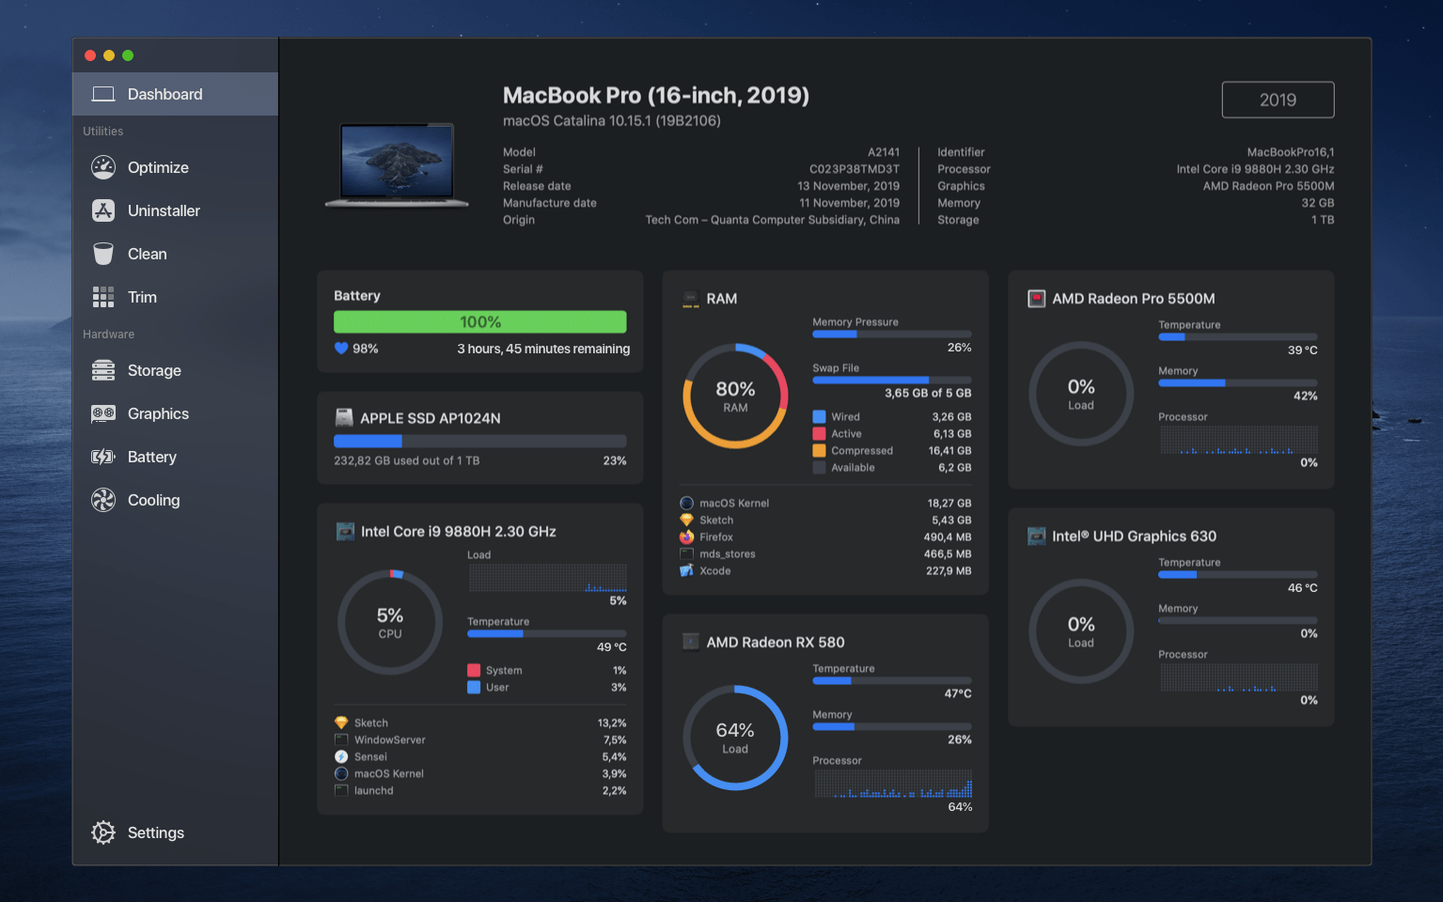
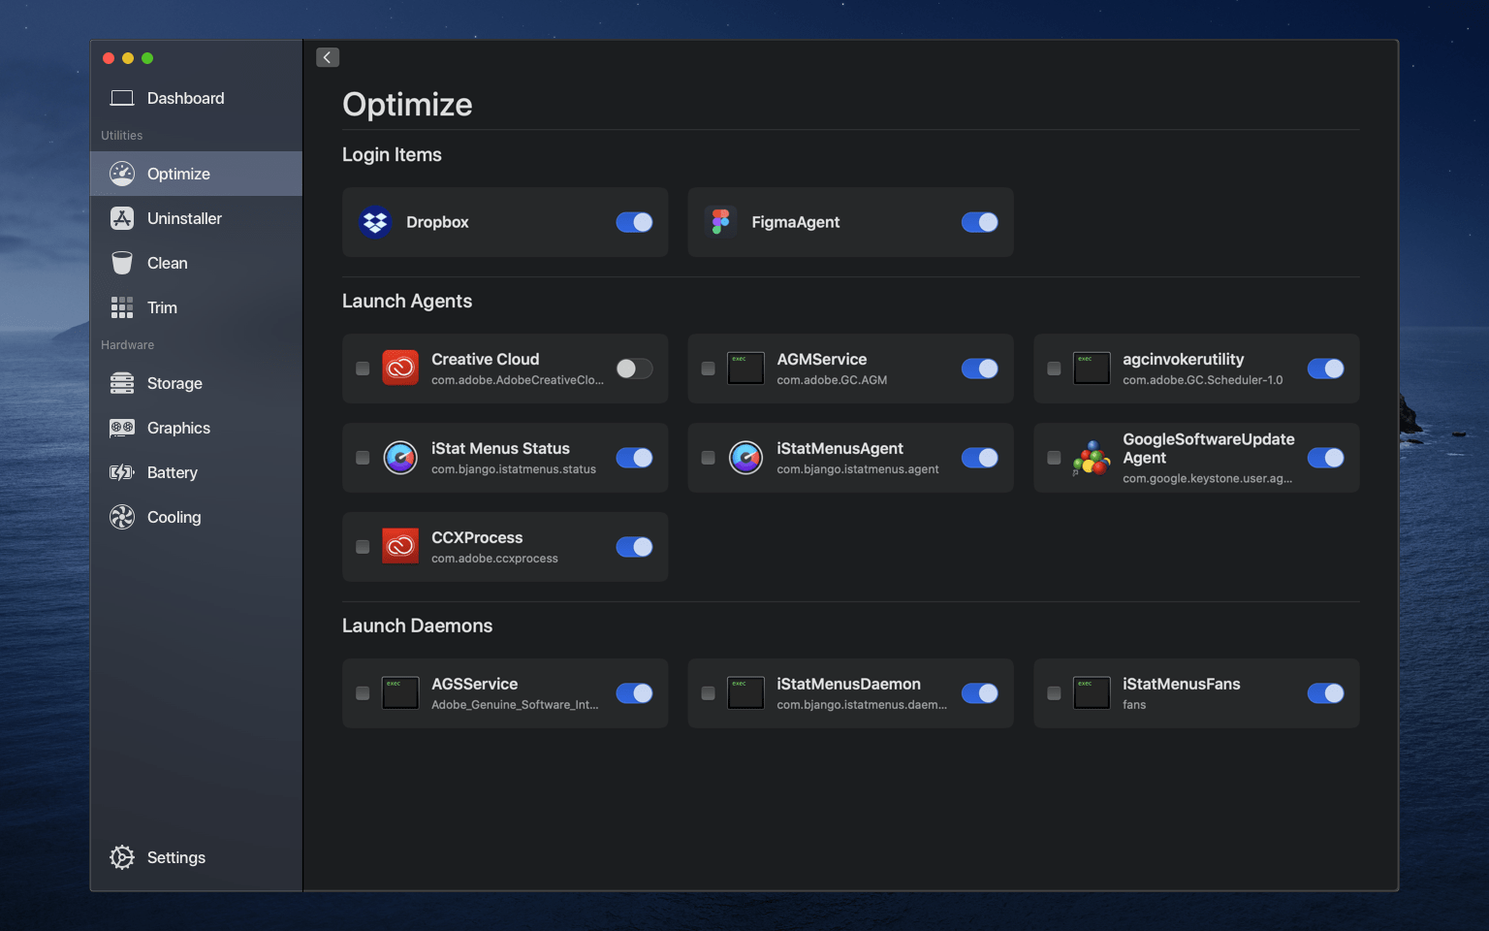
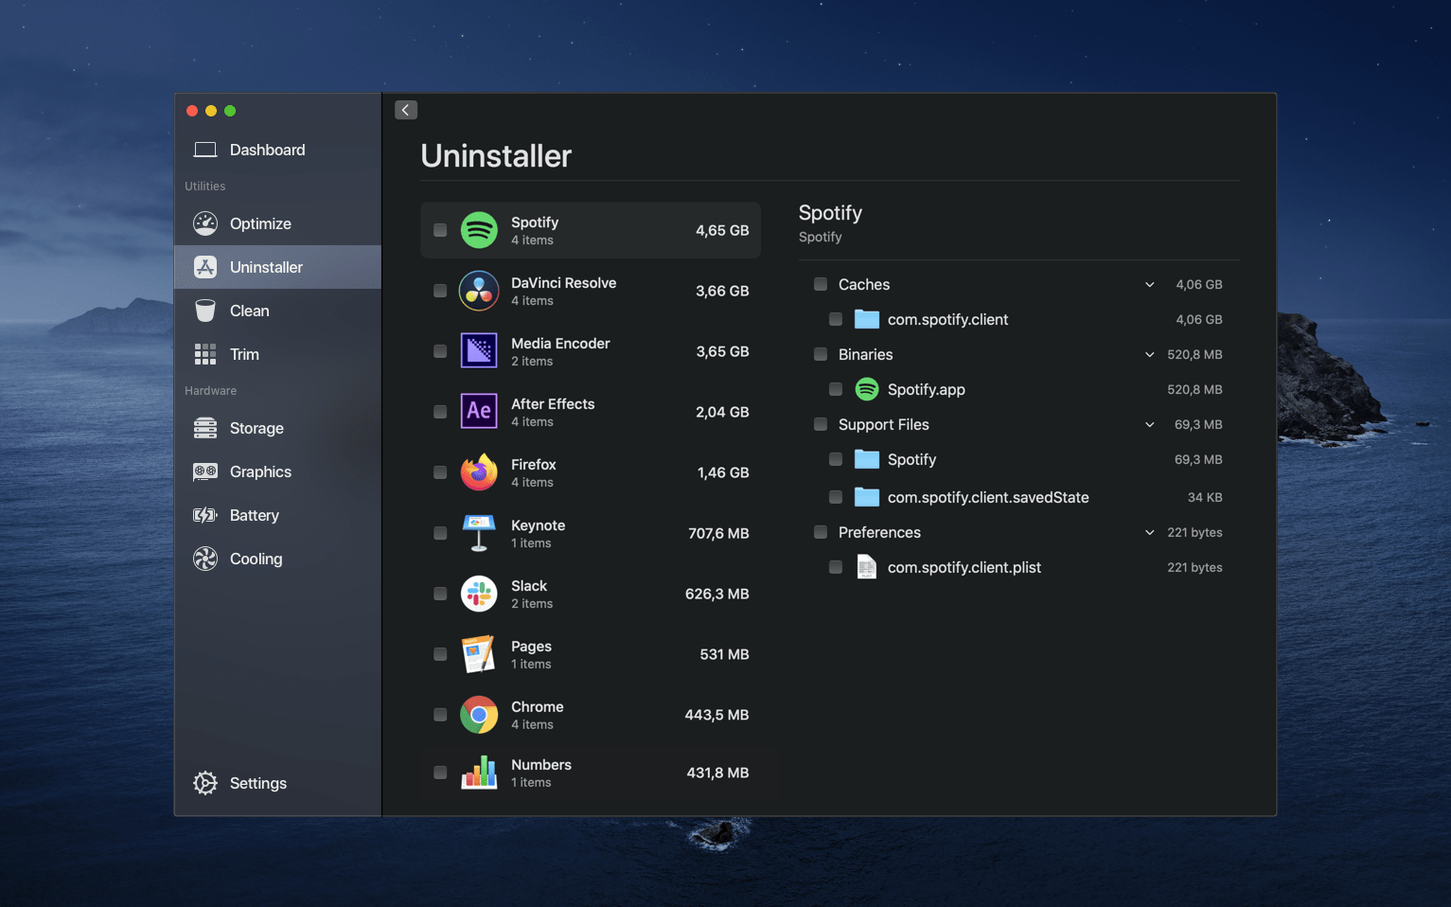
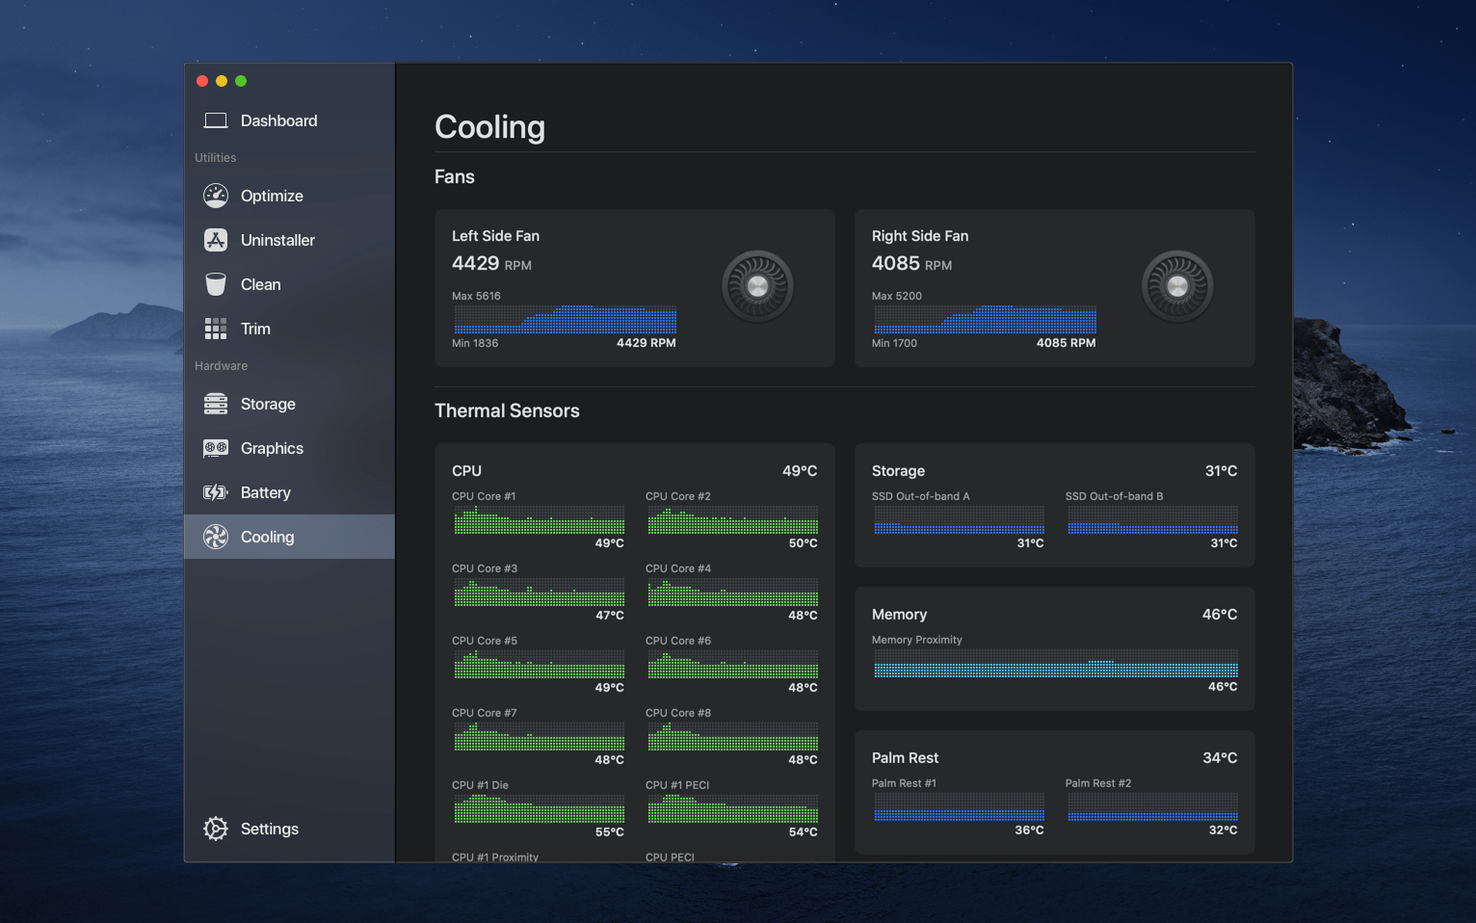
A Mac already ships with Activity Monitor and a handful of scattered tools for checking disk space, but stitching a full picture together still means opening several windows and knowing where to look. Sensei takes the main pieces — hardware monitoring, temperature readouts, and disk cleanup — and places them in one coherent interface. The result is less about adding something entirely new and more about making what is already possible quicker to reach.
The monitoring side covers CPU, GPU, and RAM usage, plus temperature sensors for key components. Fan control is included too, so you can adjust cooling behaviour directly rather than waiting for macOS to decide. A menu bar accessory keeps a live summary visible without pulling up the full window, which sits well next to other lightweight system widgets you may already run.
Alongside the readouts, the disk cleanup tools handle caches, logs, and large file scans. This puts the cleaning functions in the same place as the performance data, so you can spot a storage bottleneck and act on it without switching to a separate utility. The approach sits somewhere between a dedicated cleaner and a hardware dashboard, borrowing purposefully from both.
The interface is clean and direct, with a layout that prioritises tabs over nested menus. It does not try to replace every system tool, but it consolidates several that often end up in separate downloads. For someone who already keeps a few utilities around, Sensei reduces the count rather than adding to the pile.
Alongside the built-in tools
Activity Monitor shows process tables but no temperature graphs. System Information hides fan speeds behind a menu item most people never open. Storage Management in System Settings offers broad categories without the sweep-and-scrub precision of a dedicated cleaner. Sensei occupies the gap between those utilities — it does not compete with them so much as pull their scattered readouts into one place.
Two third-party apps sit closest in spirit. iStat Menus excels at menu bar monitoring and gives more customisation for what appears in the bar itself, but it lacks cleanup tools and disk health detail. Someone who only wants live CPU and temperature graphs may prefer it for the lighter footprint. CleanMyMac X swings the other way: its cleaning engine is deeper, with malware scanning and system maintenance scripts built in, yet its hardware monitoring is thinner and the interface feels busier. Sensei splits the difference — less cleaning power than a dedicated maintenance suite, more hardware visibility than a pure monitor, and a simpler interface than either.
None of the three handles fan control with the same directness. Sensei lets you set a base speed or define a curve tied to a specific sensor, which iStat Menus does not offer at all. That alone can make it the pick for anyone who has replaced thermal paste, works in a warm room, or simply dislikes Apple's conservative fan ramp.
Leaves Finder in charge but catches files it misses
Sensei does not try to replace Finder, Disk Utility, or the battery menu extra. It works alongside them. The uninstaller, for instance, finds files a simple drag to Trash leaves behind — but it relies on Finder for the initial app listing and respects SIP-protected locations. Disk cleanup targets user caches, logs, and iOS backups; it does not touch system snapshots or Time Machine volumes, so it coexists without conflict.
Menu bar integration matters because many people already run a clock, a calendar, and maybe a network meter up there. Sensei's menu bar accessory is compact by default and expands on click to show ring charts for CPU, memory, and disk. It sits comfortably next to Apple's own battery and Wi-Fi indicators without dominating the strip. If you prefer a single metric — say, CPU temperature only — you can trim it to that.
The app also respects macOS notification conventions. Temperature warnings and disk health alerts appear through standard Notification Centre banners, not custom pop-overs that break the system look. Shortcuts has no direct hooks into Sensei, but the menu bar Monitor refreshes independently of the main window, so you can leave it running as a persistent widget while closing the full interface. That aligns with how lightweight Mac utilities tend to earn their keep: visible only when needed, quiet the rest of the time.
Menu bar drops a process panel when the CPU spikes
Suppose the Mac feels sluggish around mid-afternoon. A glance at the menu bar shows CPU hovering above eighty percent. Clicking the Monitor ring drops down a small panel with the top processes by load. Right away, a browser tab stands out — some page running a runaway script. That is enough to identify the culprit without opening the full Sensei window.
Curiosity about temperatures pulls the main window open. The Dashboard tab shows the CPU package at 82°C, the fans still at a quiet 1800 rpm. Two clicks into the Fan Control tab, a custom curve ties the left fan to the CPU proximity sensor with a steeper ramp. Within thirty seconds the temperature drops by five degrees. Nothing dramatic, but the keyboard deck feels cooler under the palms.
Before closing the app, the Clean tab gets a quick check. A scan of user cache files turns up 1.2 GB of accumulated browser and app caches, most of them months old. Selecting and removing them takes a few seconds. No restarts needed, no dialogue boxes asking for confirmation twice. The whole session — from menu bar glance to cleanup — runs under two minutes.
A trim-and-monitor workflow
One practical use emerges after a long design session. Affinity Photo, a few file previews, and a dozen Safari tabs have been running for hours. The goal is to reclaim memory, check storage health, and leave the machine tidy for the next day.
The sequence starts in the Dashboard. Memory pressure sits in the yellow, and the swap file has grown to 4 GB. There is no action to take here directly — Sensei shows the state, and the decision comes from the user. A quick restart of the design app drops memory usage back into the green. The Dashboard confirms the change within seconds.
Next, attention turns to the drive. The Health section reports the SSD's lifetime writes and remaining life estimate. Everything reads normal, but the temperature sensor on the NAND flash shows 47°C — warmer than expected after the workload. A temporary fan curve bump helps bring that down while the rest of the workflow continues.
With thermal and memory metrics in check, the Clean tab opens for a focused pass. A custom scan targets only user logs and Xcode derived data, skipping browser history and large file scans. The result: 3.8 GB of build artefacts from a project finished last week. Deleting them frees space without touching anything risky. The whole trim-and-monitor flow fits a predictable pattern — observe, cool if needed, clean selectively — and Sensei keeps the steps within arm's reach instead of spread across three different utilities.