 Aspecten
 Download (55 MB)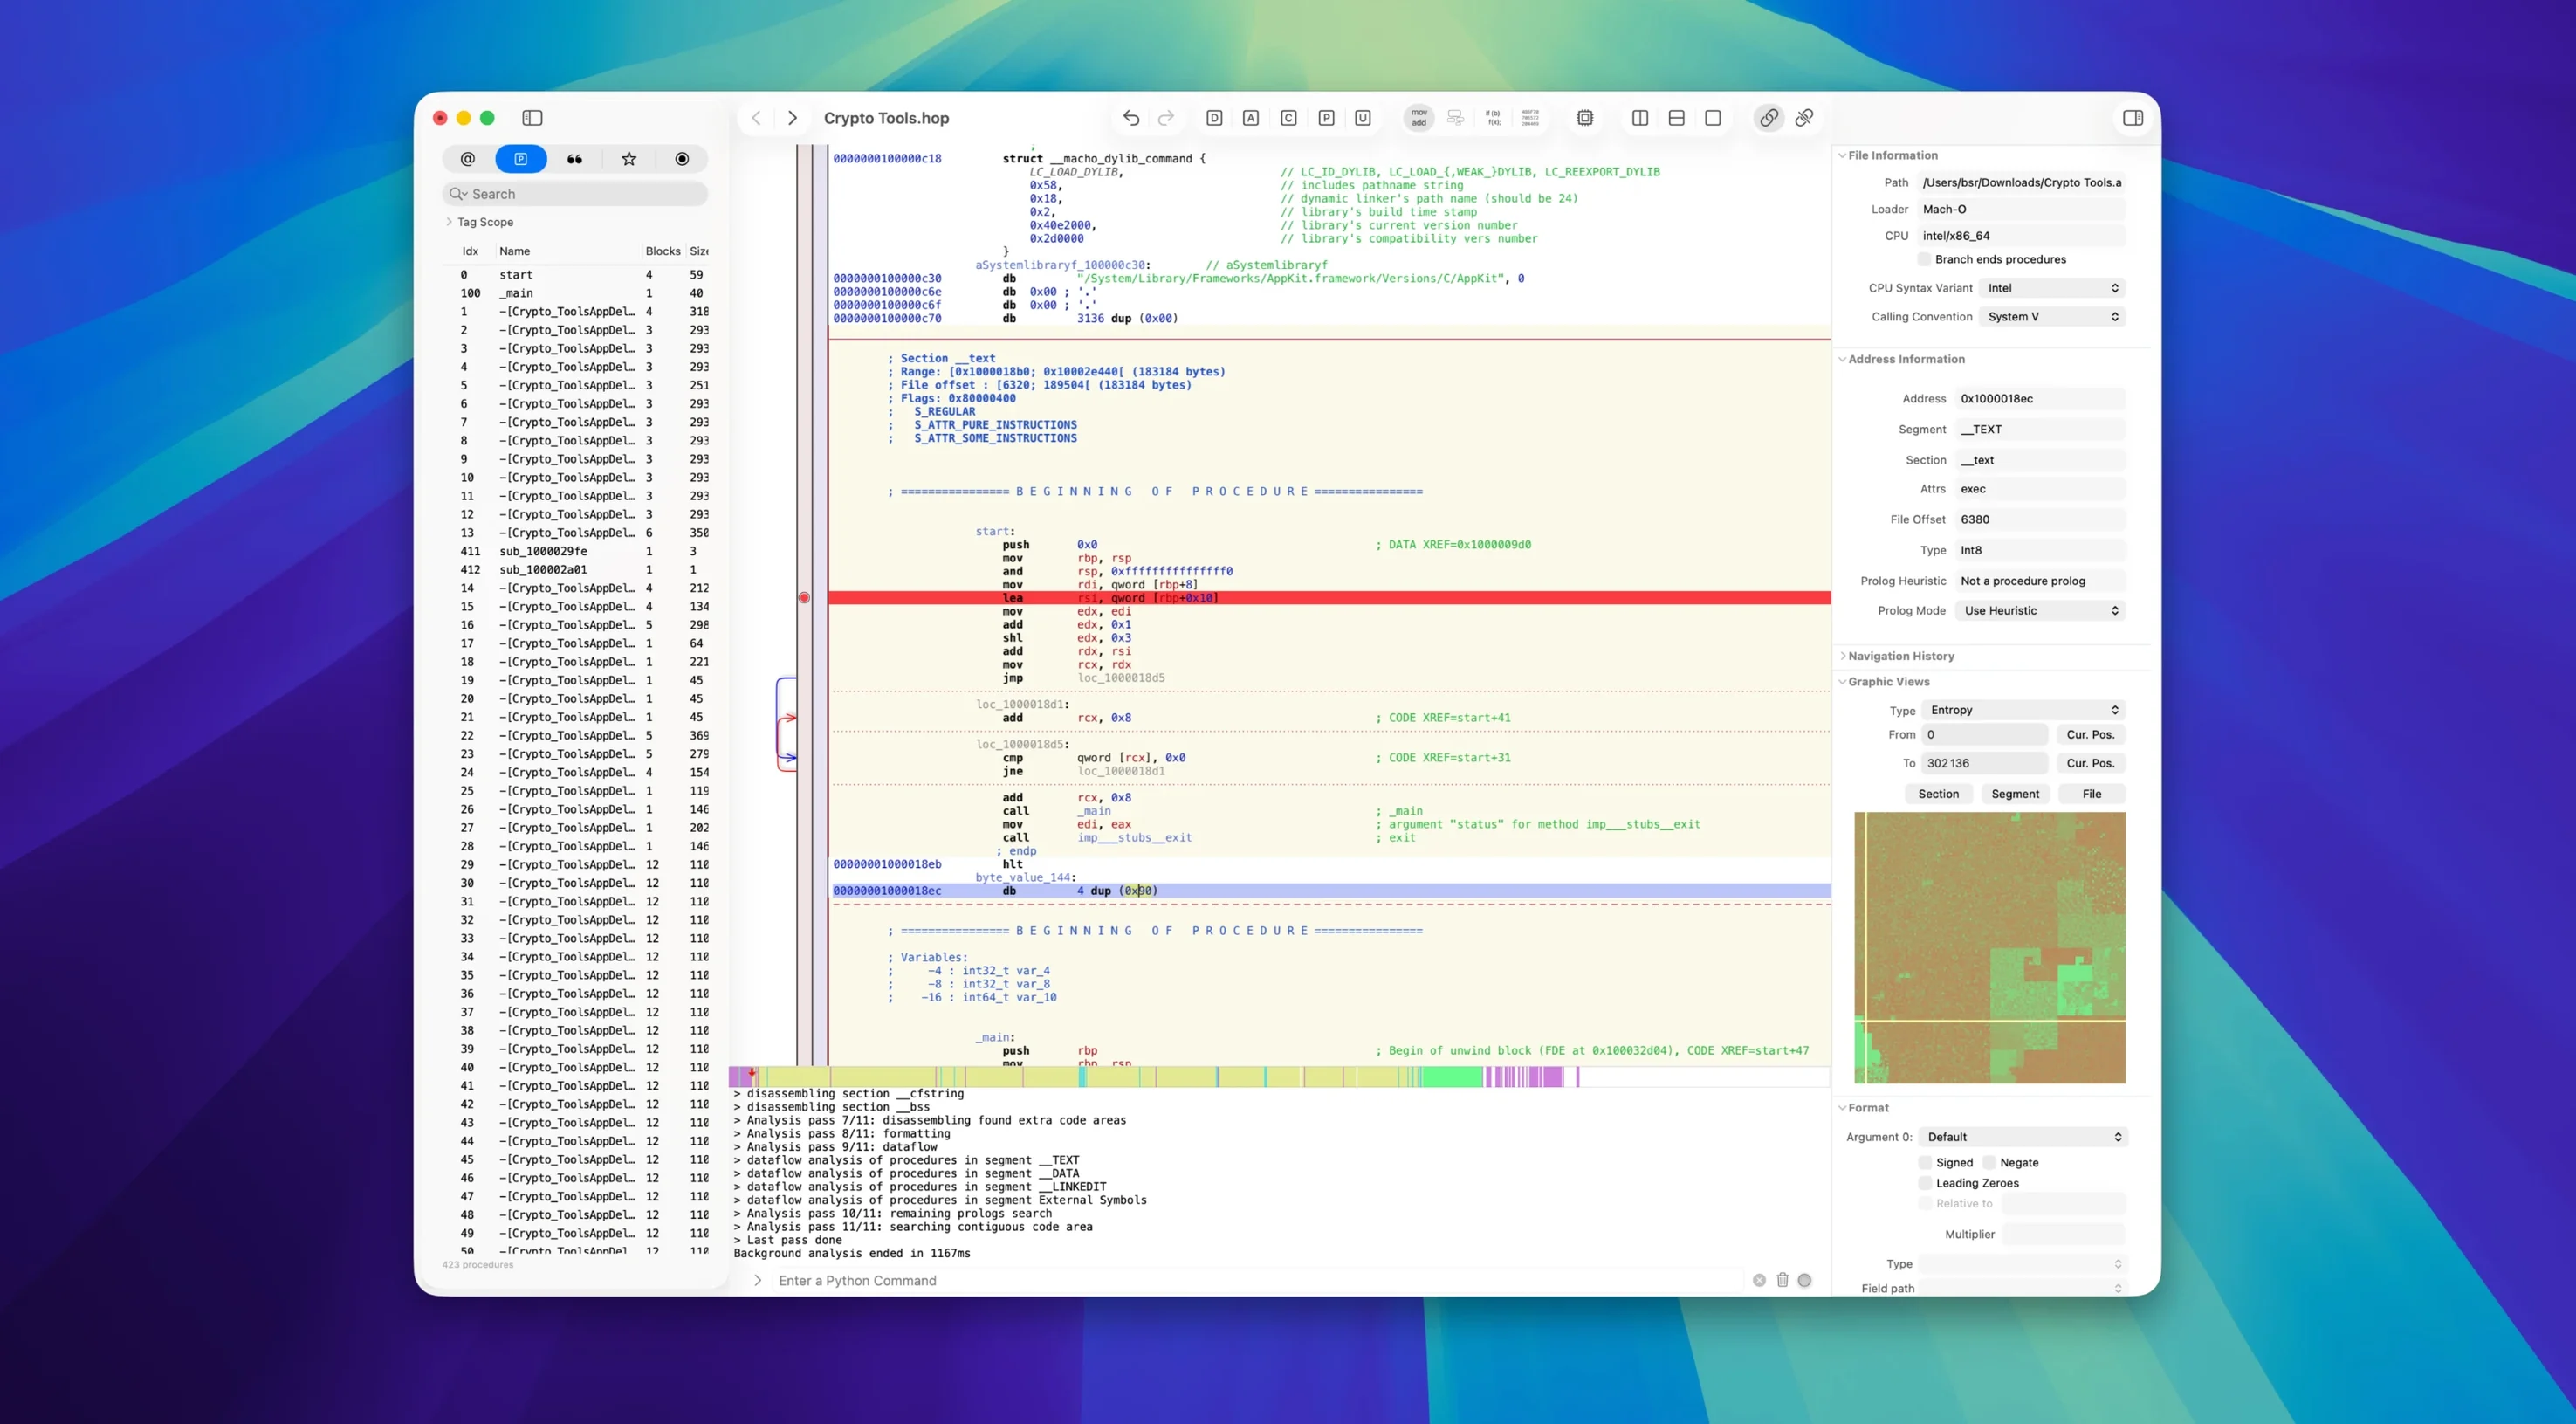
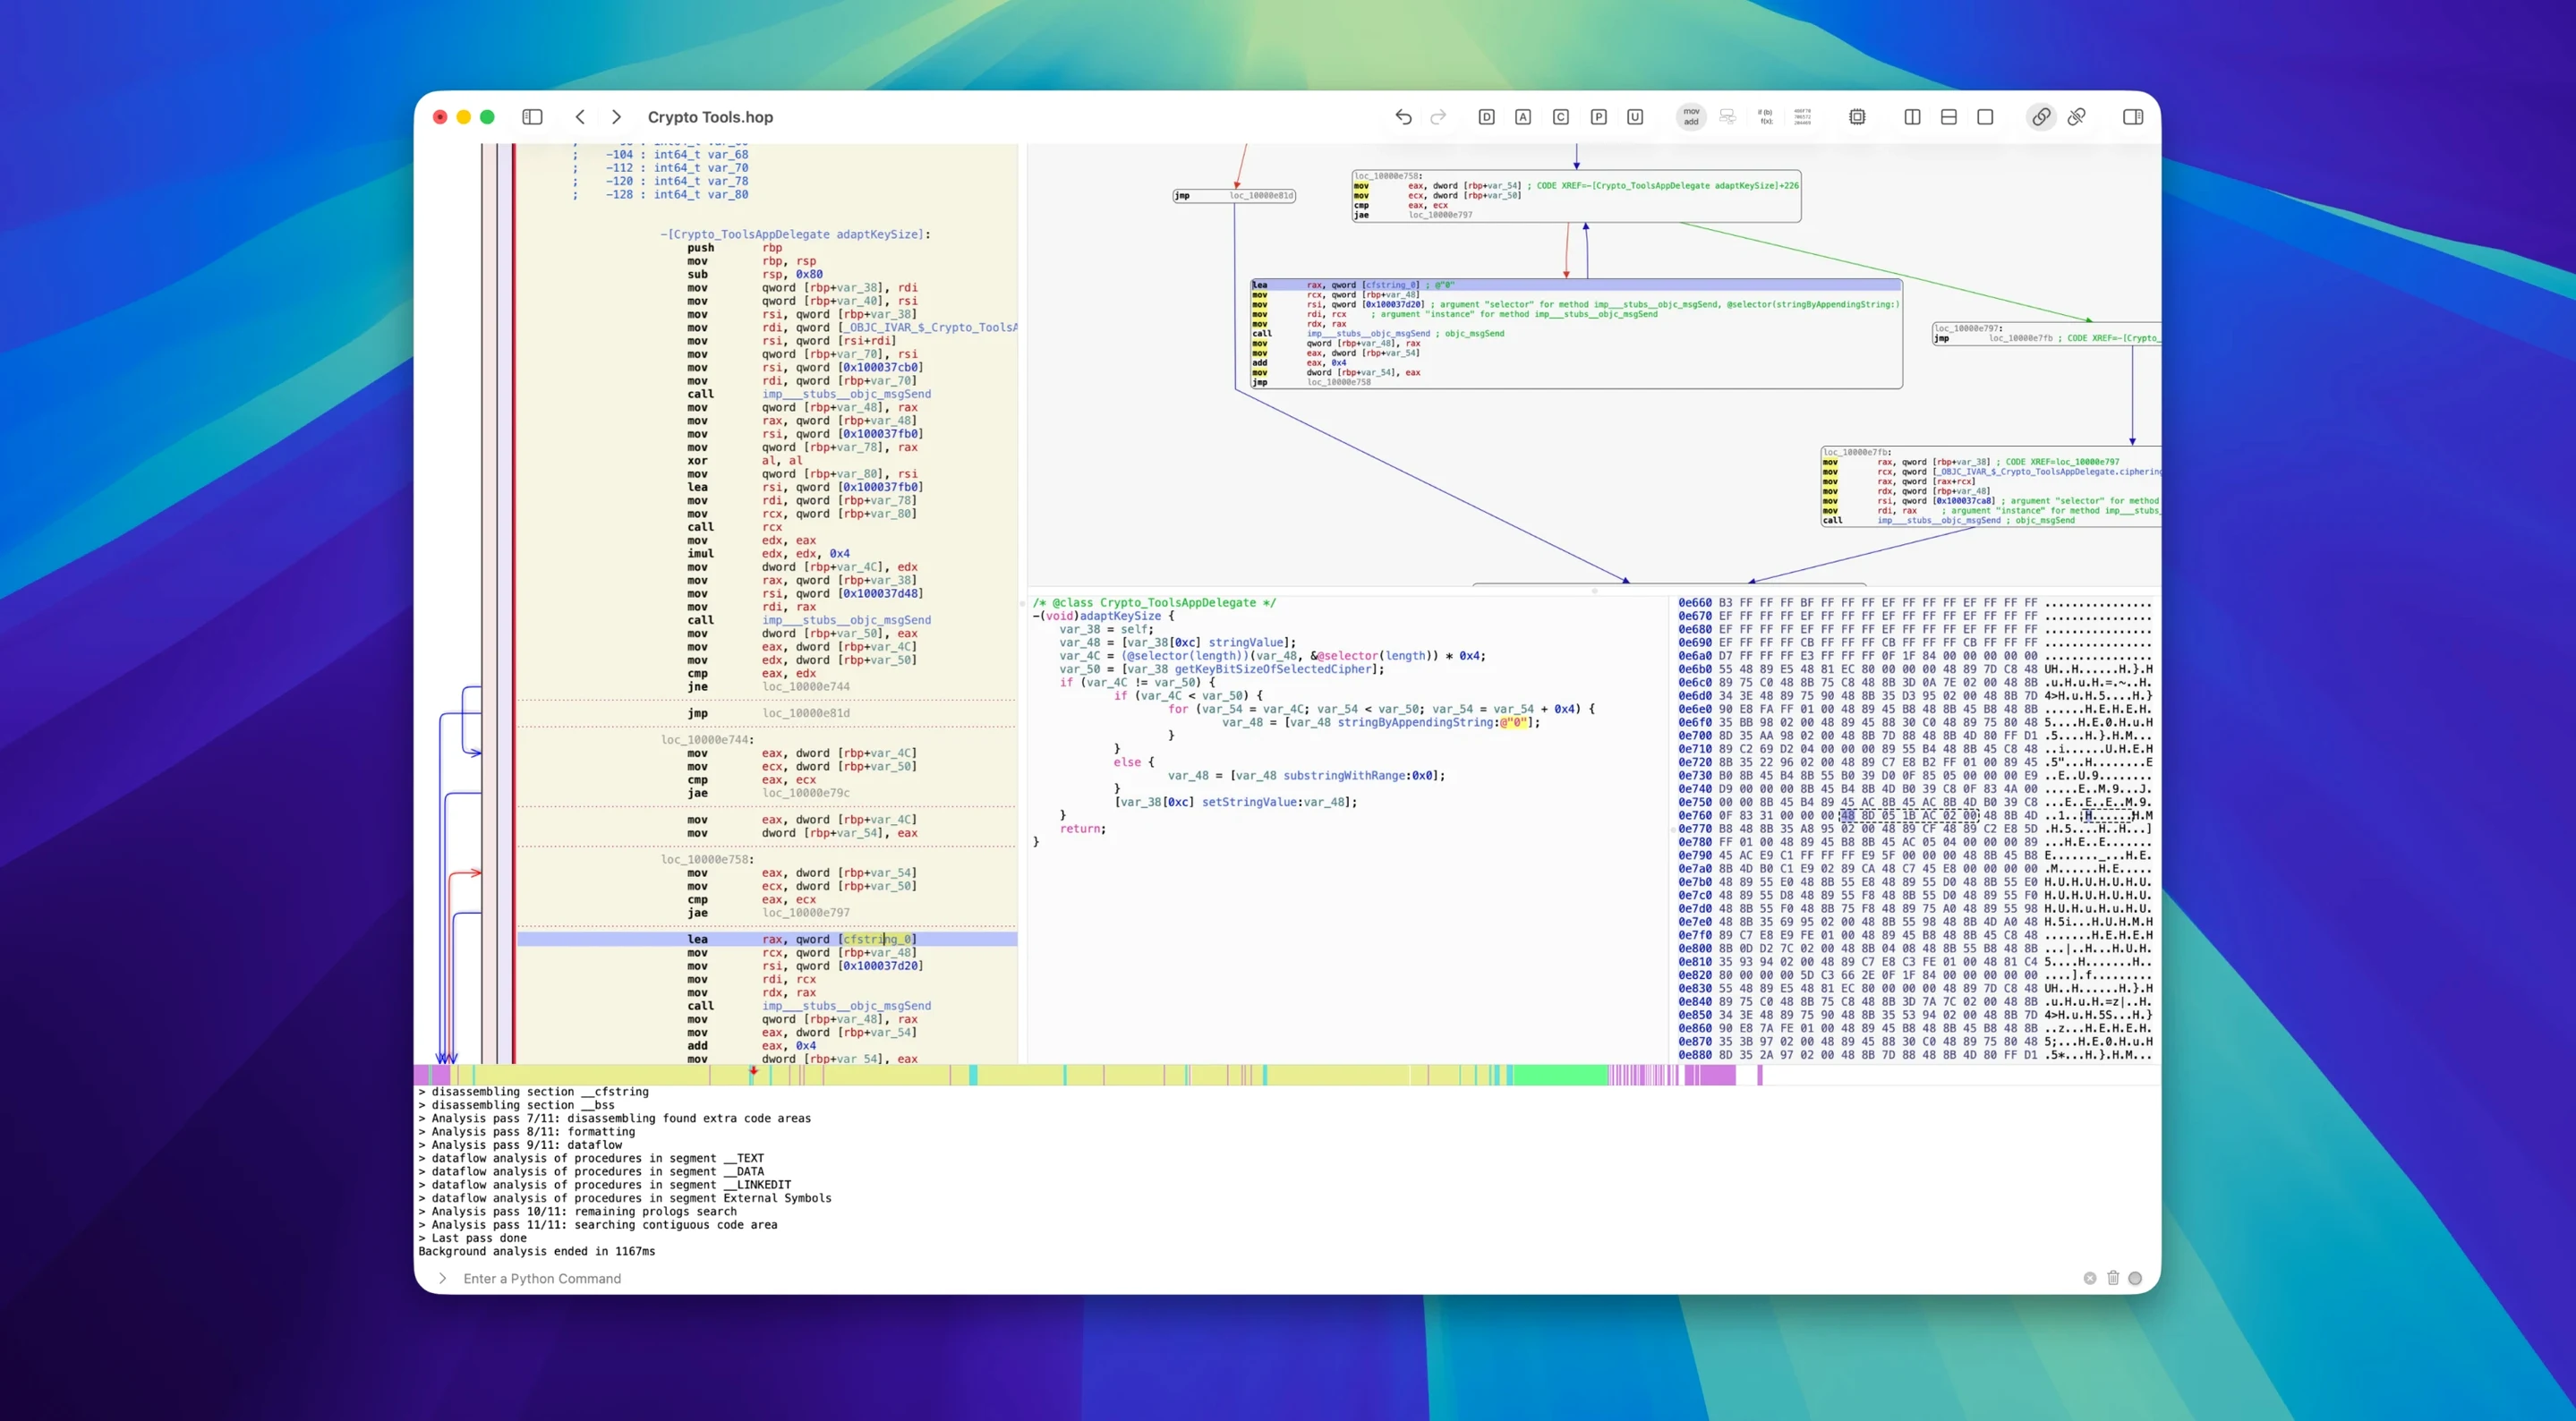
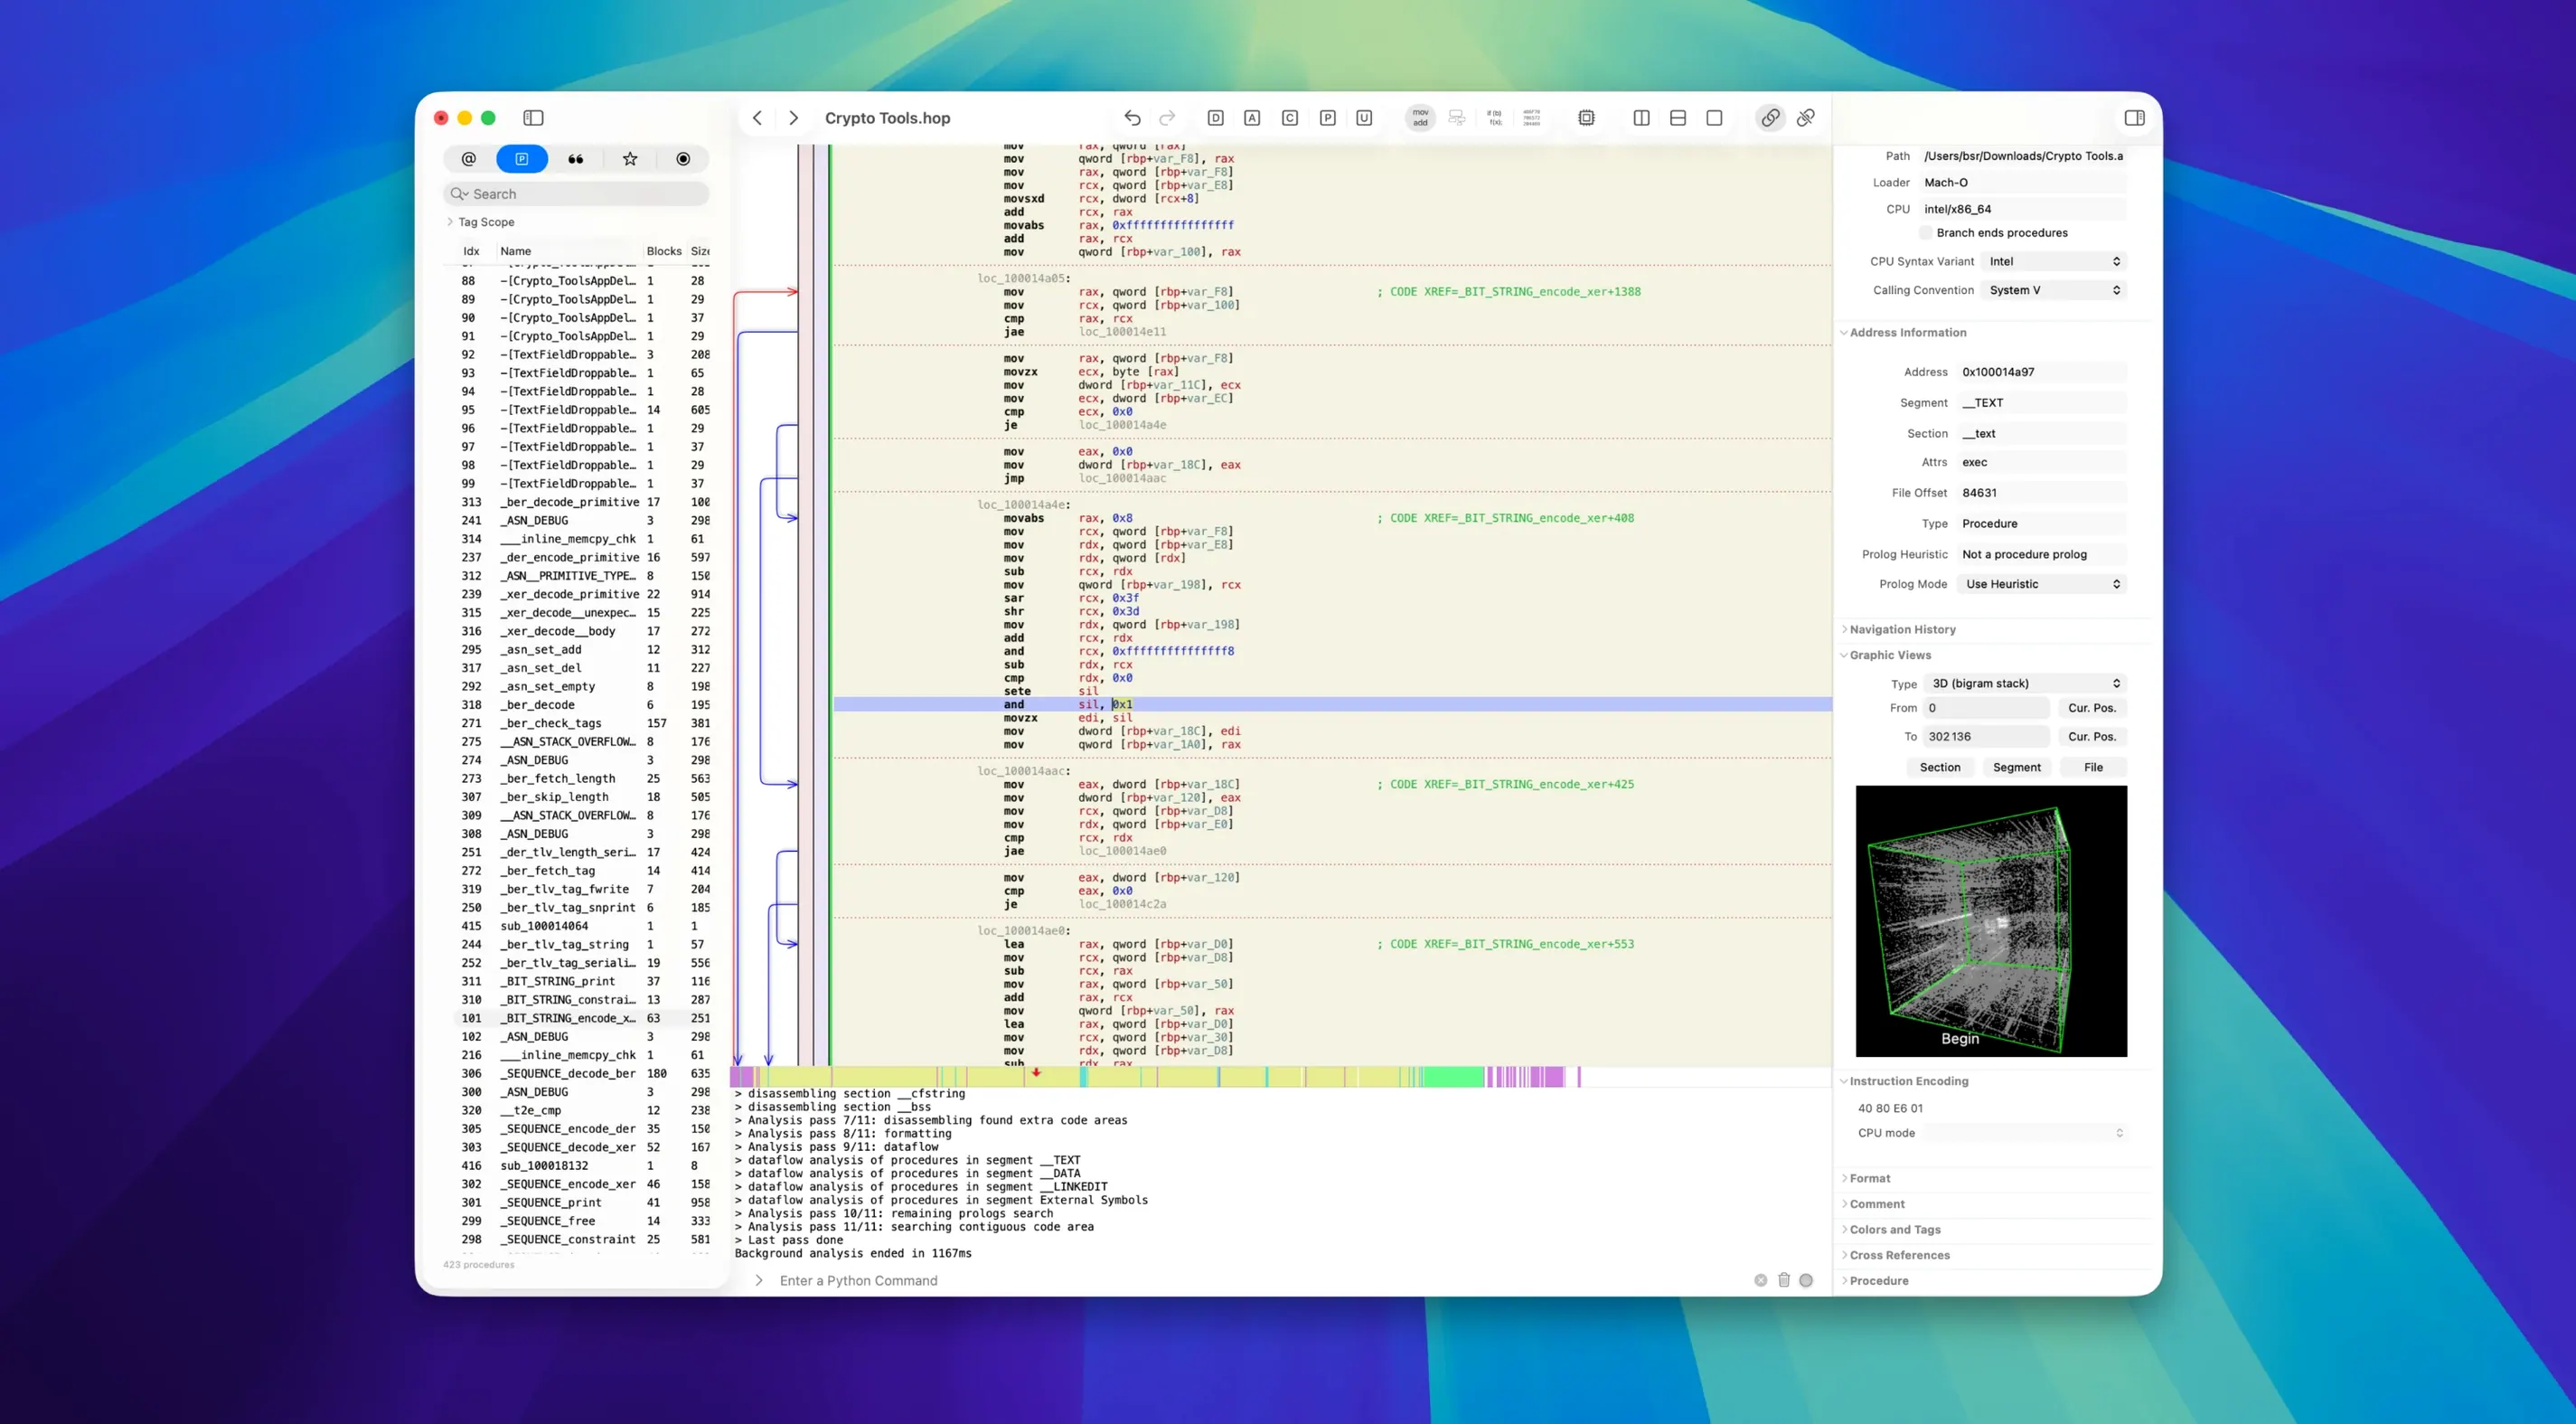
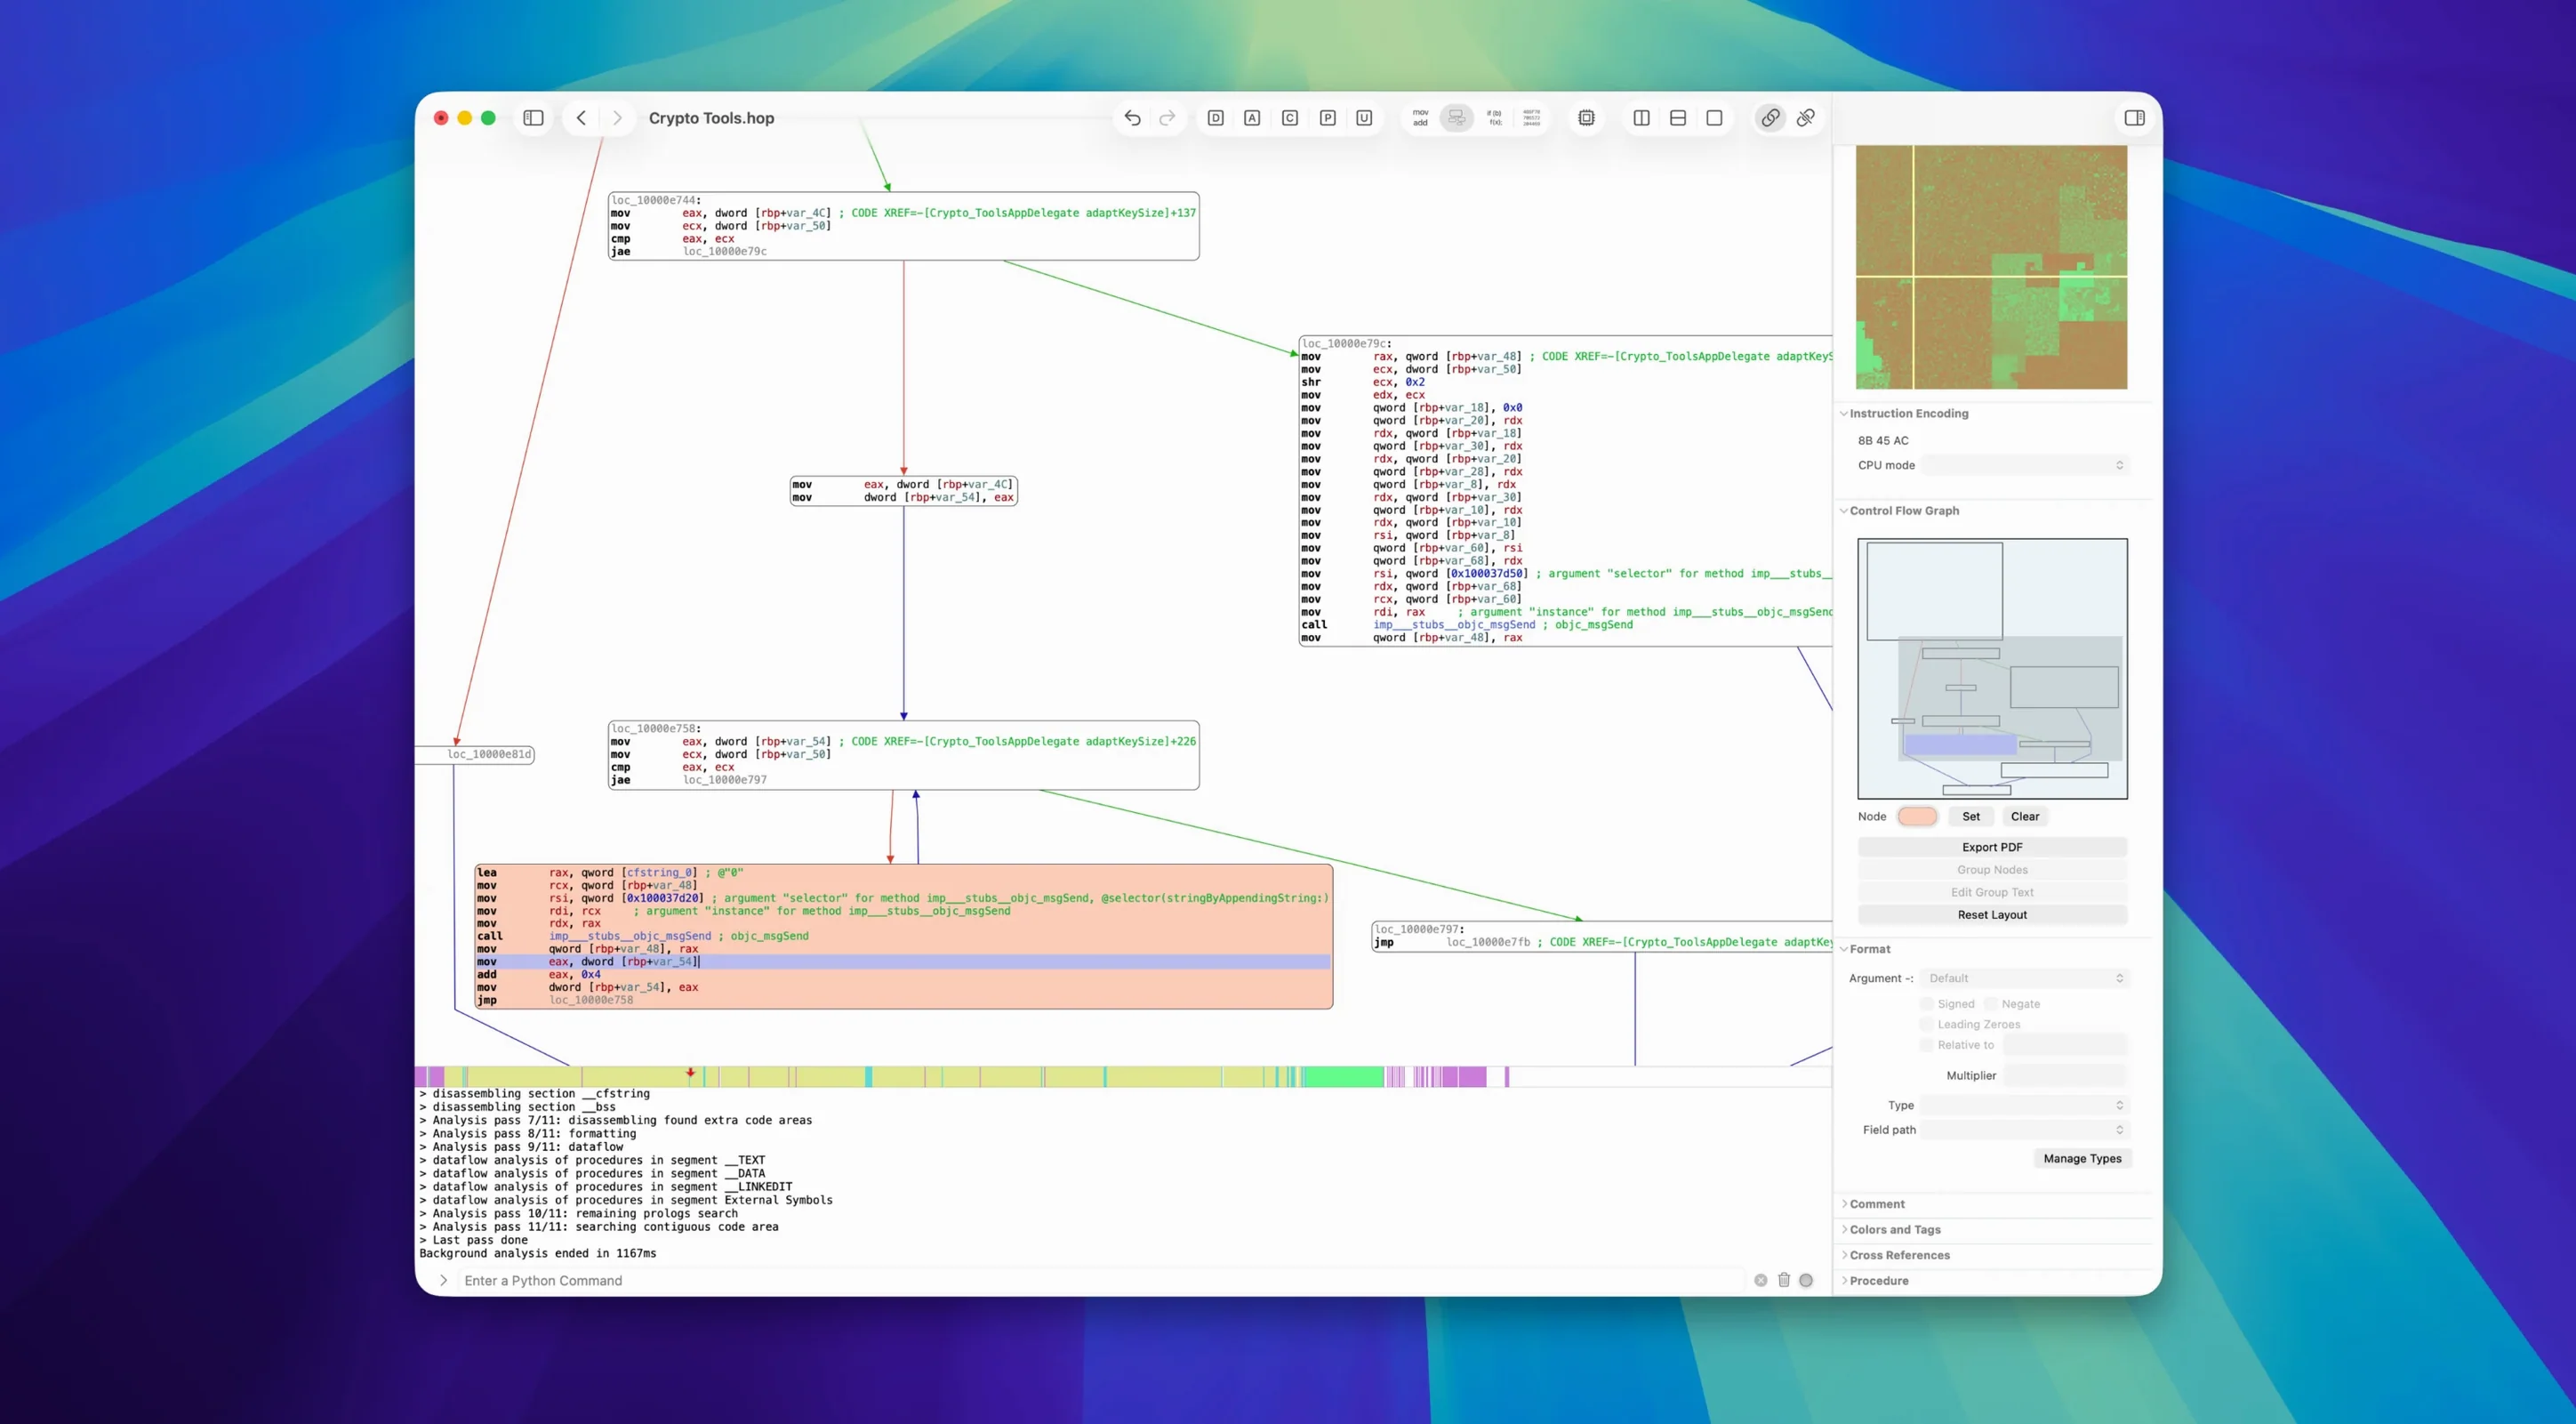
Hopper Disassembler is a binary disassembler and decompiler for Unix systems built with a native Cocoa interface.
Inspecting binaries across Win32, ELF, and Mach-O formats
- Examining file contents, procedures, stack variables, and objects inside a binary
- Working across common formats such as Win32, ELF, and Mach-O
- Analysing code compiled for x86_64 and ARMv7 architectures
- Integrating the tool with other macOS applications via standard Cocoa behaviours
macOS 11+ requirement and a small-team release rhythm
- Requires macOS 11 or later and runs on Apple Silicon architecture
- The interface is presented in English only
- Published by Cryptic Apps SARL, a small developer, which can mean a slower update cadence
Integration with other tools and macOS features
Because Hopper is built on Cocoa, it inherits a few macOS conventions that make it fit naturally alongside other analysis tools. The Services menu works for selected text in the assembly or decompiler panes, so you can pipe a hex string or a symbol name straight to a terminal script or a notes app. Drag-and-drop from Finder loads a binary without going through the open dialog, and you can drop a file onto the dock icon when Hopper is not yet running.
Hopper also plays well with GDB-based debugging sessions. You can set breakpoints from within the disassembly view, then step through a running process while the control-flow graph highlights the current basic block. For annotating findings, copying a procedure's pseudocode and pasting it into a Markdown document preserves enough formatting to keep the logic readable. If you use a separate hex editor, Hopper's offset references stay consistent because it respects the original file layout rather than introducing virtual address schemes that break when you switch tools.
Tracing how a Mach-O tool parses a config file
Suppose you have a Mach-O command-line tool and you want to understand how it parses a configuration file. A typical session might run like this.
Open the binary and let Hopper finish its initial auto-analysis. In the left sidebar, filter the procedure list with a keyword like parse or config. The matches narrow quickly. Select a candidate, and the assembly pane shows the full disassembly. Switch to pseudocode mode with a single click to see a reconstructed C-like representation.
From the pseudocode, you spot a call to fopen followed by a loop that reads lines. Mark those lines as bookmarks so you can return later. Open the control-flow graph view for that procedure; the loop structure becomes a visible back-edge, confirming that the function reads until EOF. If the binary is not stripped, Hopper's procedure list also shows the original symbol names, which helps you cross-reference with any public documentation or headers you have.
Now you want to check what happens under a specific condition. Set a breakpoint on the conditional jump after the fgets call, attach GDB, and run the tool with a test config file. When execution pauses, Hopper highlights the current instruction and you can inspect register values. The session produces enough detail to document the parsing logic or write a small compatibility library.
Toggle assembly and pseudocode with the Space bar
Several useful touches sit just below the surface. Pressing Space in the assembly or pseudocode view toggles between the two representations at the same address, which is faster than switching via the toolbar. The N key renames a symbol in place, and the change propagates through every reference in the current file.
In the hex view, selecting a byte range and pressing D cycles through data representations: byte, word, dword, qword, and ASCII string. This works particularly well when you suspect a raw data block is actually a string table. The search bar supports regular expressions, so finding sequences like mov\s+rax,\s*\[rbp across a large binary is straightforward.
The procedure list respects column sorting. Clicking the "calls" column header pushes the most-connected functions to the top, which often surfaces dispatch routines or central error handlers before you have read a single line of assembly. Right-clicking a procedure name and choosing "Show references" opens a flat list of every call site, each clickable to jump straight to the instruction. On Apple Silicon Macs, the native ARM build keeps scrolling and graph rendering responsive even with binaries that contain several thousand procedures.