 Aspecten
 Download (584 MB)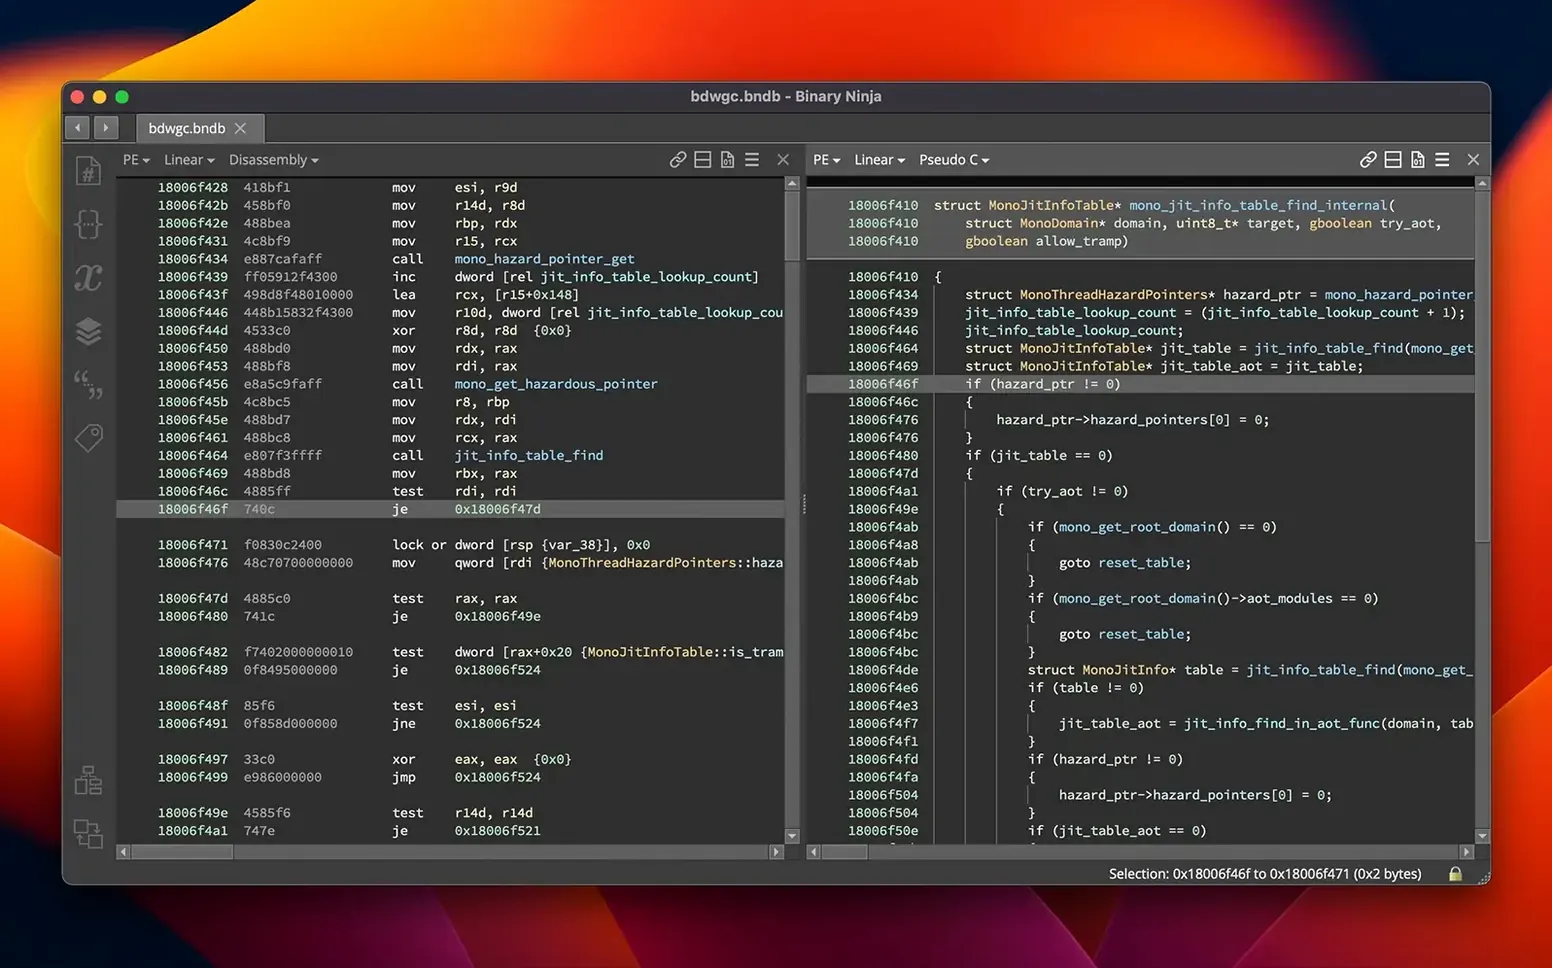
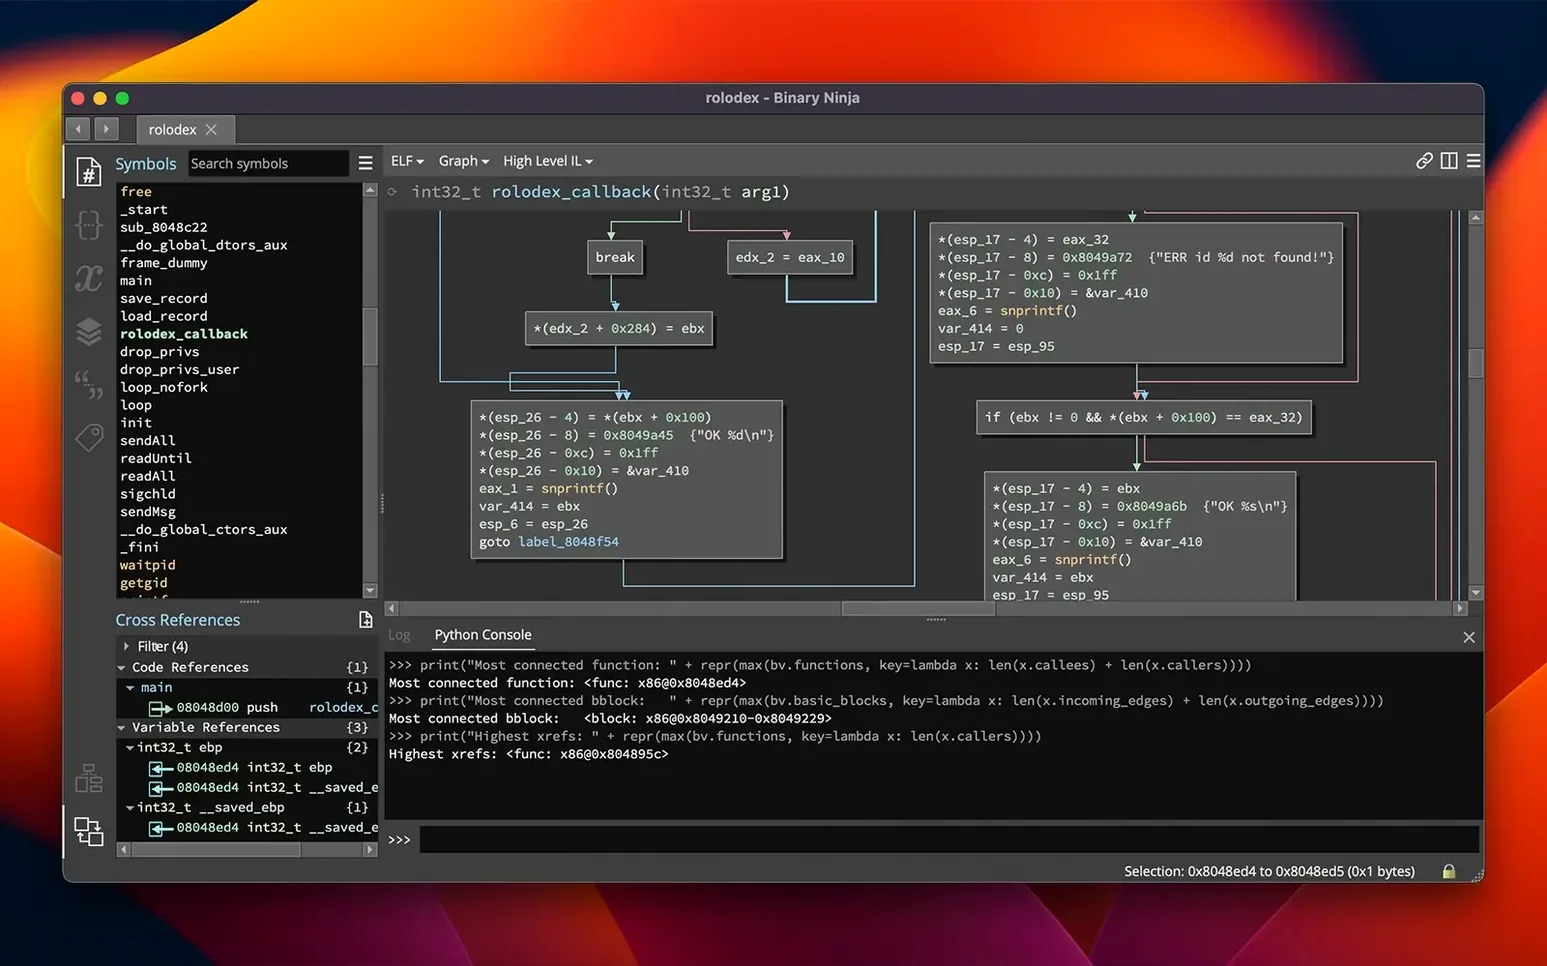
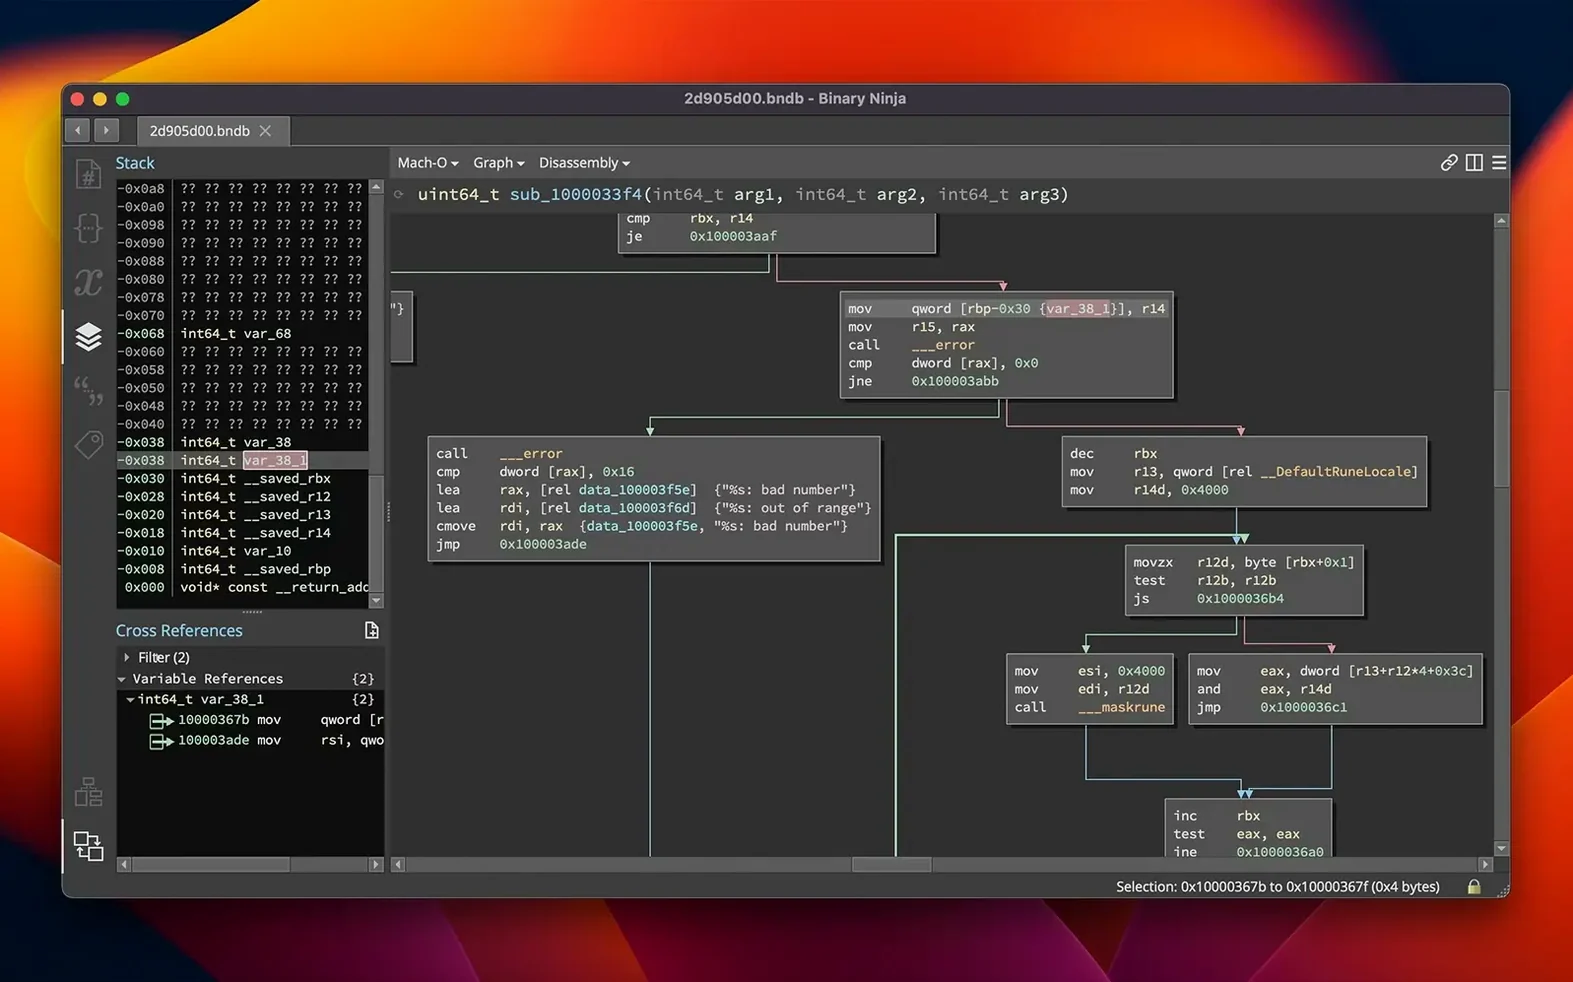
Memory usage improvements in version 6.0 let Binary Ninja open binaries that rival the size of entire disk images without exhausting available RAM. That concrete ceiling matters more than a feature list when you are staring at a single opaque firmware blob.
How does the decompiler present recovered code?
It lifts machine instructions into BNIL, an intermediate language, and then generates C output. You can switch between the two views, applying types and struct definitions to progressively tidy the listing into something closer to the original source.
What does the binary similarity feature actually compare?
New in 6.0, Binary Similarity indexes functions across two or more binaries and surfaces matches that survive compiler optimisations. An analyst hunting a known vulnerable routine inside a patched library can locate it without manually diffing thousands of symbols.
How do you change behaviour without recompiling outside the tool?
Binary patching is built in. You edit raw bytes in the hex view, replace instruction sequences in the assembly panel, or compile small C snippets with the bundled SCC compiler, then write the patched binary straight back to disk.
What helps when an executable is completely unknown?
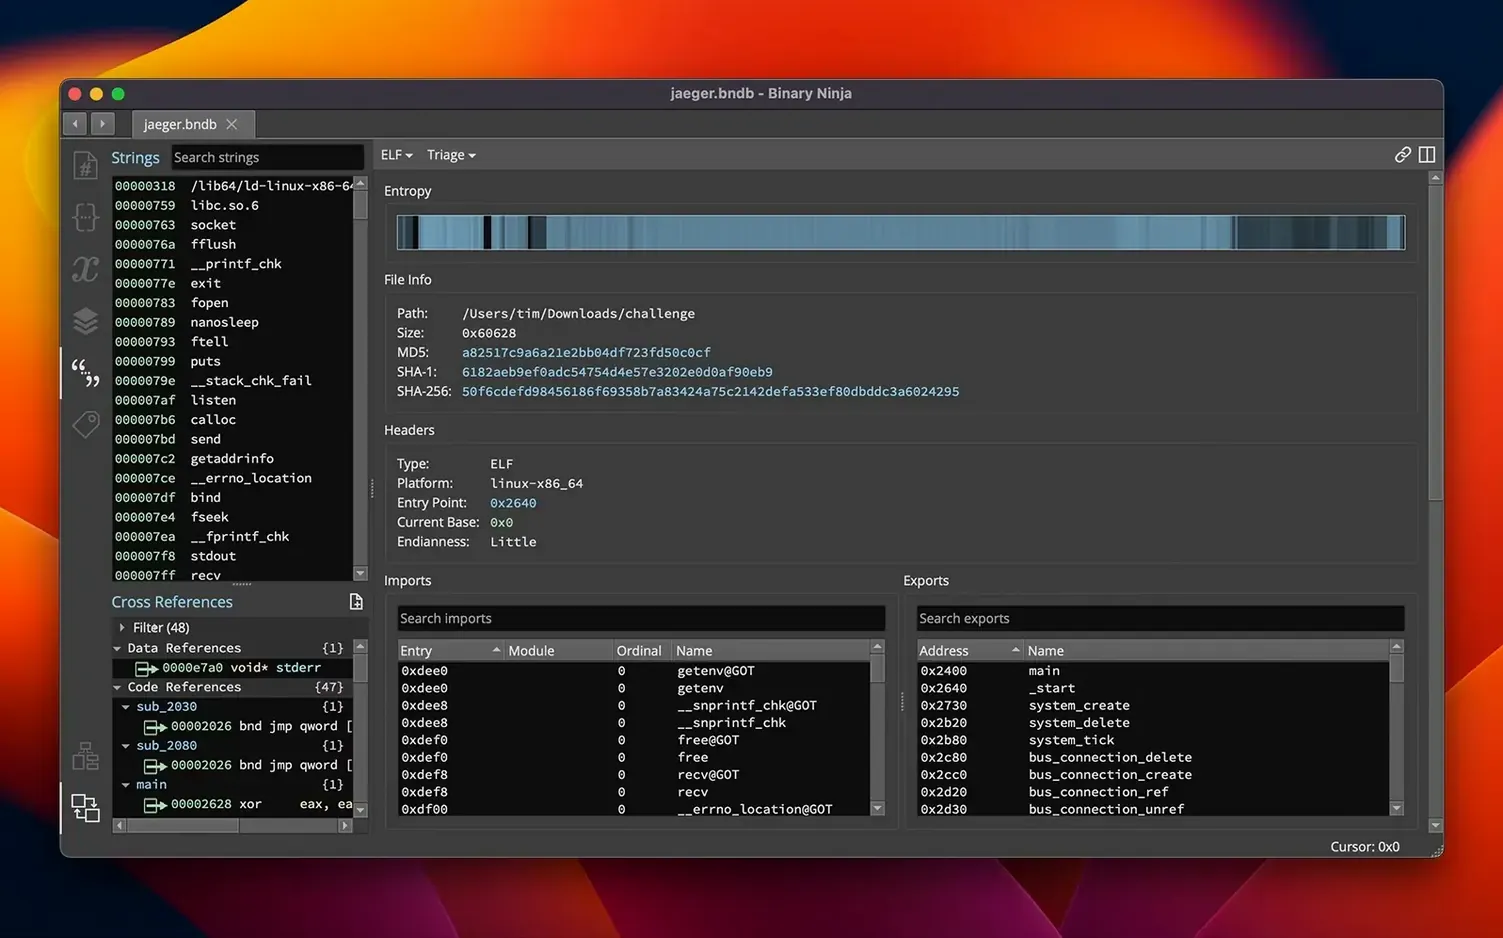
The entropy graph maps the whole file in one bar-chart view, highlighting packed or encrypted regions in contrast to plain code and data. Together with batch processing, it gives you a starting point even for statically linked firmware with no symbols.
Ghidra recovers types aggressively, while Binary Ninja exposes IL earlier
Ghidra and Binary Ninja overlap more than they diverge on paper, yet the pacing of analysis feels different. Ghidra’s decompiler produces aggressive type recovery and leans hard on its project-sharing model. Binary Ninja surfaces its intermediate language earlier in the workflow, which can help when you need to script analysis passes before the decompiler runs. Ghidra’s interface assumes patience; Binary Ninja updates the graph and listing with less lag on the same hardware.
IDA Free covers x86-64 only and locks out many of the features a working analyst needs. Binary Ninja’s personal edition limits commercial use but does not shrink the architecture list or the API surface, so you keep access to the Python and C++ bindings across ARM, MIPS, PowerPC and the rest. Hopper is lighter and macOS-native in a way that appeals for quick triage, though its decompiler output and plugin ecosystem are smaller. If you spend half your day in scripting, Binary Ninja’s API consistency across platforms pulls ahead.
Activation drops after macOS updates—run the bundled tool again
One recurring complaint is around activation state dropping after a macOS point update. The simplest recovery is running the bundled activation tool again; no reinstallation needed. Another tripwire is the personal edition refusing to load a binary because it was tagged as a commercial project in a previous session. Clearing the database directory for that file resolves it.
On Apple Silicon, stale Python paths sometimes cause extension loading failures. Removing the cached plugin index and letting the Extension Manager rebuild it usually fixes the silence. A few users have also found that the entropy graph refuses to render when a binary is opened over a network share; copying it locally clears that up immediately.
Triage an unsymbolicated kernel extension through entropy and IL views
A researcher pulls a kernel extension from an older build of a device driver. There are no symbols, just a raw Mach-O slice. They load it into Binary Ninja, glance at the entropy graph to confirm no packing, then launch the new Binary Similarity feature against a known-vulnerable version of the same driver. Two functions match with high confidence, both in the packet-parsing path. They rename them, apply a struct definition recovered from an earlier engagement, and the decompiler output turns from pointer arithmetic into comprehensible field access. Within the hour they have a candidate overflow. They patch the length check in the assembly view, write the modified binary back, and ship it to a test device—all without leaving the workspace.
Show native instructions next to the lifted IL in a split disassembly view
Out of the box, the disassembly view uses a default column layout that hides the BNIL representation. Switching to a split view that shows native instructions and the lifted IL side by side clarifies what the decompiler will see later. Under Edit > Preferences > Analysis, turning on aggressive recursive descent suits firmware blobs that lack proper symbol tables, and it avoids leaving large code regions undiscovered.
The theme defaults to light mode. Many analysts switch to the dark theme immediately; it reduces eye strain during long reverse-engineering sessions. It is a small change, but one that rewards you every minute you spend staring at a control-flow graph. Finally, in the Extension Manager, enabling the debugger extension early ensures that stepping through a live target is available the moment you need it, without an awkward restart in the middle of an analysis session.