 Aspecten
 Download (2.4 GB)
Version 16.93 now bundles new charts and an Ideas feature for visualising data patterns, so a fresh install gives you a slightly different starting point than earlier builds.
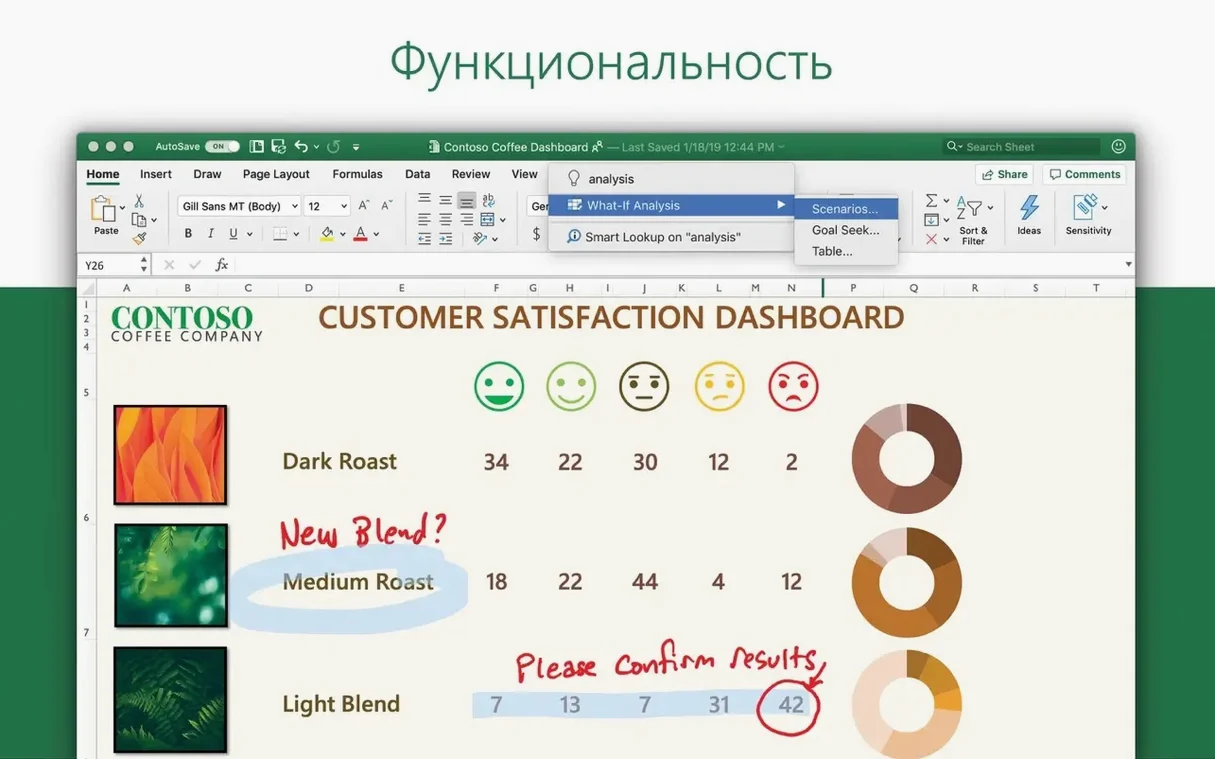
Charts — the recommended chart types appear in the ribbon under Insert. Select a data range first, then pick a layout; the engine suggests variants based on what you selected. Stacked bar, treemap and funnel are worth trying early on.
Ideas — found on the Home tab. Highlight a table block and click Ideas to see a pane of automatically generated pivot summaries, outlier flags and trend charts. It is a quick way to spot something worth investigating without building formulas yourself.
Collaboration — the Share button in the top-right corner sends a link to a workbook saved in OneDrive or SharePoint. Colleagues in accounting or audit workflows can edit simultaneously; cell locks and sheet protection still apply locally.
Languages — the interface switches between twenty-one languages, including Russian, Hungarian, Korean and Swedish, via the macOS Language & Region pane.
Excel on the Mac suits a few specific working styles better than others, and version 16.93 makes this pattern clearer than it was two years ago. The people who extract the most value fall into three rough groups. First, anyone whose daily work already orbits OneDrive or SharePoint — if your team lives inside Microsoft 365, the Mac version stops feeling like a port and starts behaving like the same tool you use on a Windows laptop. Shared workbooks open with co-authoring active by default, and the coloured presence indicators in the top-right corner match what colleagues see on their side. Second, financial analysts and accountants who rely on Power Query on Windows will notice its absence here, but those who build models with array formulas, LET and LAMBDA will find everything they need. Third, researchers and university staff who juggle large data sets benefit from the Ideas pane as a low-effort first pass: highlight a few thousand rows of climate readings or survey responses, click once, and skim the suggested outliers before writing a single formula.
The common thread is that these users treat Excel as a calculation and modelling layer rather than a database. If your work involves a moderate number of rows — tens of thousands, not millions — and you value charting and collaboration over raw data-crunching speed, the Mac version fits comfortably.
Scrolling 30 000 rows at 60 fps on Apple Silicon
On an Apple Silicon Mac, Excel launches in roughly two seconds cold and under a second warm. Scrolling through a 30 000‑row table with conditional formatting stays smooth at 60 frames per second; the same workbook on an older Intel machine with 8 GB of RAM shows a slight stutter when zooming past 150 %. Memory use settles around 400–600 MB for a typical session with three workbooks open, each containing a few sheets of formulas and charts. That figure climbs when Ideas generates summaries — the feature briefly allocates an extra 200 MB while it scans the selected range — then releases it once the pane populates.
Stability in 16.93 is uneventful in the best sense. A week of leaving the app open across sleep-wake cycles, switching between external monitors and pasting data from Safari and Numbers produced no crashes. The one recurring quirk involves Excel’s own recalculation engine: if a workbook contains volatile functions like NOW() or RAND() in thousands of cells, the app occasionally pauses for half a second during an autosave. Disabling background saving in Preferences eliminates it.
Battery impact is moderate. A two-hour session of light editing, chart tweaking and one Ideas query drew about 18 % of a MacBook Pro battery, which is comparable to running Outlook and Teams side by side. The biggest drain comes from real-time co-authoring with a dozen collaborators; each remote edit triggers a small recalculation pass, and the cumulative effect is noticeable after ninety minutes.
Drag a range straight onto a chart to update it instantly
Several shortcuts and behaviours hide just beneath the surface and never announce themselves.
- Drag-and-drop chart data — after inserting a chart, you can drag a new data range directly onto it from the sheet. The chart updates without reopening any dialogue.
- Control‑Option‑Return — in a cell, this inserts a line break in Excel for Mac, matching the Windows Alt‑Enter habit that trips up switchers.
- Quick Analysis tool — select a range and look for the small icon that appears at the bottom-right corner. It is easy to miss because it vanishes if you click elsewhere. The tool offers one‑click conditional formatting, sparklines and running totals without touching the ribbon.
- Sheet navigation menu — right-clicking the sheet tab arrows at the bottom left opens a scrollable list of all sheets. In workbooks with 30‑plus tabs, this saves more time than it first appears.
- Recent files in the Dock — right-click the Excel icon to see the last five workbooks, not just the app. Pin one and it stays there.
- Paste Special shortcuts — after copying,
Control‑Command‑Vopens the Paste Special dialogue immediately, skipping the ribbon entirely. - Formula builder pane — the fx button next to the formula bar opens a resizable side panel that keeps function arguments visible while you click around the sheet. It is far more practical than the pop‑up wizard on Windows for longer formulas.
None of these are new in 16.93, but they are the kind of thing you stumble across after months of use and wonder why nobody mentioned them.
Opening a shared OneDrive budget workbook on a Tuesday morning
Imagine a Tuesday morning. You open a workbook a colleague shared overnight — a quarterly budget forecast with tabs for each department. The file sits on OneDrive, so Excel opens it directly and shows your colleague’s last saved view. Three coloured circles in the top-right corner mean the finance team is already inside.
You start on the Marketing tab. The numbers look plausible, but the variance column catches your eye. You select the whole range, click Ideas on the Home tab, and the side pane populates within two seconds. One suggestion flags an unusual spike in Q2 travel expenses. You click the suggested pivot and Excel inserts it on a new sheet, filtered to the relevant rows and columns.
Curious, you highlight the travel subcategory and pick Insert > Recommended Charts. The treemap option makes the anomaly obvious at a glance — one account code is using up a third of the travel budget. You drag the chart onto a summary sheet you are building for the 11 a.m. call.
While you work, a comment notification slides in from the bottom edge of the screen. Another analyst has asked about your Q2 assumption on the Assumptions sheet. You click the notification, Excel jumps to the cell, and you reply in the threaded comment pane without leaving the workbook. The comment syncs instantly; the analyst’s presence dot flickers as they start typing a response.
You finish by protecting the summary sheet — Review > Protect Sheet, set a password, confirm — and save. The workbook autosaves to OneDrive silently. You close the lid and walk to the meeting room. The whole session took twenty minutes and the only formula you wrote was a simple SUMIF you added by habit.
How Excel fits with other apps and macOS
Excel 16.93 integrates with the Mac environment in ways that feel more deliberate than in earlier versions. The most obvious link is with Outlook for Mac: when you copy a chart in Excel and paste it into a new email, the mail client offers to embed it as a static picture or to attach the source workbook. Choosing the picture option pastes a high‑resolution PNG that stays sharp on Retina displays, and Outlook keeps the colour profile intact.
Numbers, Apple’s own spreadsheet, can open .xlsx files directly, but the translation is imperfect. Conditional formatting rules with custom formulas often break, and charts lose their exact styling. The safer path is to keep Excel workbooks in their native format and use Numbers only for quick viewing. In the other direction, exporting a Numbers file to .xlsx from within Numbers produces a workbook that opens cleanly in Excel, though merged cells sometimes shift by a row.
macOS Quick Look deserves a mention. Select an .xlsx file in Finder and press the space bar; the preview shows the first sheet with scrolling enabled. It is fast enough to check a figure without launching the full application. Spotlight indexes cell contents too, so typing a supplier name into the menu bar search can surface a workbook you last edited six months ago.
For those who prefer local storage over OneDrive, Excel works with iCloud Drive folders without complaint. The app treats them like any other directory, though co-authoring requires OneDrive or SharePoint, so an iCloud‑stored workbook opens as read‑only for collaborators. Time Machine backups include the files normally, and version browsing works as expected — you can restore last Thursday’s version of a budget workbook from the Time Machine interface while Excel is closed.
Shortcuts, the macOS automation framework, can launch Excel and open a specific file, but deeper scripting still leans on AppleScript or the newer Office JavaScript API. A simple AppleScript to refresh all data connections and save looks like three lines and runs from the Script Editor without fuss. Power Query is not available on the Mac, so anyone moving from a Windows workflow that depended on it will need to rebuild those data pipelines using external tools or manual imports — an adjustment that stings less if your sources are mostly CSV files or SQL databases accessible via ODBC.
Finally, the app plays well with Stage Manager and multiple Spaces. You can keep a full‑screen Excel window on one desktop and drag a chart onto a PowerPoint slide on another without either app losing its context. Split View with Teams on one side and Excel on the other makes referencing a spreadsheet during a video call feel natural, especially with the new macOS window‑tiling shortcuts in Sequoia.